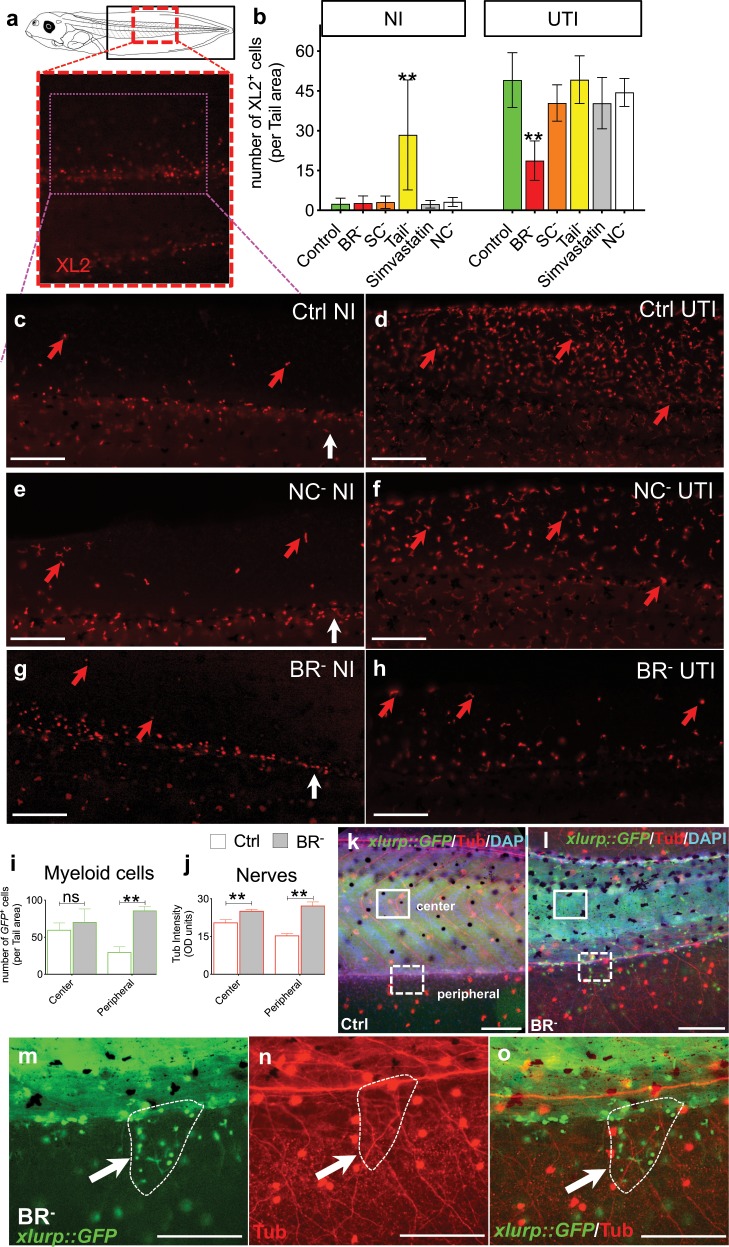
Fig. 4. The absence of early brain affects number and patterning of myeloid cells, distributed in proximity to the aberrant neural network.
a–h XL2 immunofluorescence to label leukocytes in uninfected (NI) and infected (UTI) embryos belonging Control (Ctrl, green), Brainless (BR–, red), Spinal Cord Resection (SC–), Tailless (Tail–), Simvastatin-treated, and Neural Crest ablation (NC–) groups. a Drawing of a late-staged Xenopus embryo. Black rectangle indicates the tail area for counting. Magenta-dashed line outlines the region showed in (c)–(h). b Number of XL2+ cells (normalized to the area) per each group and condition. c–h Lateral views of Ctrl (c, d), NC– (e, f), and BR– (g, h); NI (c, e, g) vs. UTI (d, f, h) embryos. Red arrows point XL2+ cells. White arrows point the posterior region of the central blood vessels. i, j Number of myeloid cells (i) and acetylated alpha-tubulin (Tub) optical density (OD; j) per each tail region for Ctrl (white), and BR– (gray) st. 46–48 embryos. k–o Lateral views of xlurp::GFP Ctrl (k) and BR– (l) embryos after Tub immunofluorescence. GFP+ myeloid cells are green, Tub+ nerves are red, nuclei are blue after DAPI staining. Differences in tail morphology for BR– animals (deviating the normal body axis (l) with respect to Ctrl (k)) are due to developmental muscle mispatterning occurring when brain is absent. Two independent tail regions were counted: center (occupied by the myotomes; solid-white line) and peripheral (dorsal and ventral lateral fins; dashed-white line). Counts were made at the same region of the animals (e.g., at the same somite level). m–o Details from (l), white-dashed square. White arrows indicate positive elements at the same point on the three images. Dashed-white line circle an area within scattered groups of immune cells lying in proximity to the highly disorganized neural networks. b, i, j Data represent the mean and SD of, at least, ten different embryos, from different replicates, per each group and condition. Significant P values after post hoc tests are indicated as **P < 0.01, ns P > 0.05. Images: rostral is left, dorsal is up. Scale bar = 250 μm. See also Supplementary Fig. S3.

