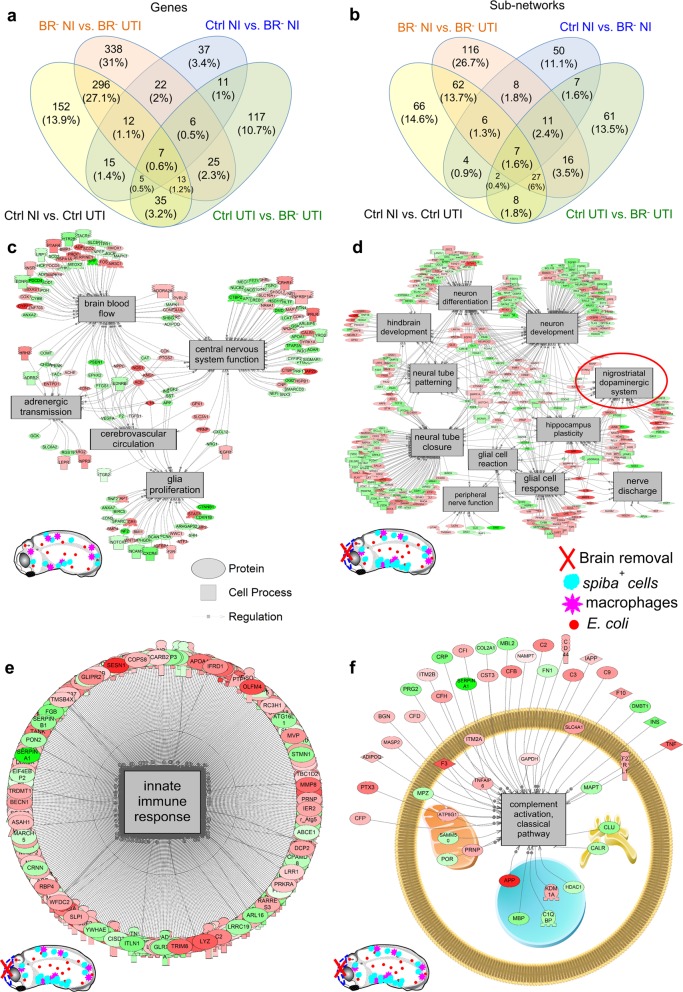
Fig. 5. Transcriptional analysis of Control (Ctrl) and Brainless (BR–) datasets show quantitatively and qualitatively differences for regulated transcripts and cell processes after infection (UTI) or/and not-infection (NI) conditions.
a, b Venn diagram comparing genes (a) and sub-networks (b) differentially regulated for each experimental group-condition. c Neural-related pathways unique to infection with a brain. d Neural-related pathways unique to infection without a brain. e Innate immunity response for brainless animals with infection. This network was significantly upregulated by 11%. f Complement activation sub-network (classical pathway) exclusively present in infected embryos with absence of brain. Green = down gene, Red = up gene. Complete data are presented in Supplementary Data 1. All measured genes found in a pathway are located in Supplementary Data 2. See also Supplementary Figs S4 and S5.

