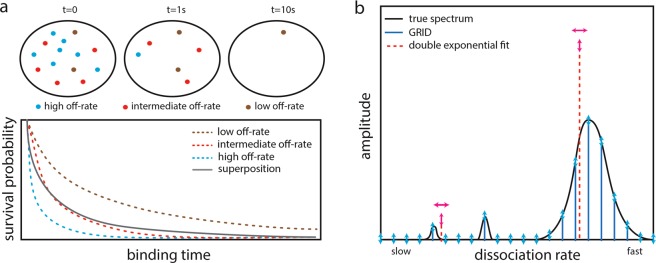
Figure 1.
Working principle of GRID. (a) Sketch of a TF exhibiting three distinct dissociation processes from chromatin (upper panel). The resulting survival time distribution is a superposition of the survival times of all three processes (lower panel). (b) Sketch of a decay rate spectrum (black solid line) underlying a complex survival time distribution. In common multi-exponential analysis, the number of decay rates has to be guessed and their values and amplitudes are varied (red dashed lines). In contrast, GRID only varies the amplitudes of a grid of decay rates (blue solid lines). Degrees of freedom are indicated by arrows.

