Figure 1.
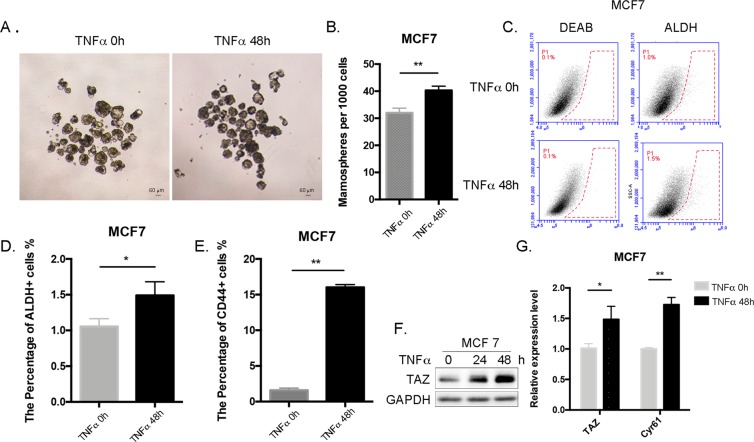
TNF-α increases BCSCs and TAZ expression in MCF-7 breast cancer cells. (A) TNF-α increases BCSCs in MCF7 cells, as measured by mammosphere culture. MCF7 cells were treated with 10 ng/ml TNF-α or 0.1% BSA for 48 h, and cells were seeded at a density of 1,000 cells per well and cultured for 14 d. The number of primary mammospheres with diameter ≥60 μm was then quantified. (B) The number of primary mammospheres per 1,000 cells initially seeded was quantified (mean ± SEM; n = 3). **P < 0.01, t-test. (C) TNF-α increases BCSCs in MCF7 cells as measured by ALDH assays. MCF7 cells were treated with 10 ng/ml TNF-α or 0.1% BSA for 48 h. Cells were collected for aldehyde dehydrogenase assays by FACS. (D) The percentage of ALDH + cells was quantified (mean ± SEM; n = 3). *P < 0.05, t-test. (E) TNF-α increases BCSCs in MCF7 as measured by CD marker staining. MCF7 cells were treated with 10 ng/ml TNF-α or 0.1% BSA for 48 h. The cells were collected for CD marker staining by FACS. The percentage of CD44 + cells was quantified (mean ± SEM; n = 3). **P < 0.01, t-test. (F) TNF-α induces TAZ protein expression in MCF7 cells. MCF7 cells were treated with 10 ng/ml TNF-α or 0.1% BSA for 24 h and 48 h, respectively. TAZ protein levels were measured by Western blotting. (G) TNF-α induces TAZ and CYR61 mRNA expression in MCF7 cells. TAZ and CYR61 mRNA levels were analyzed by RT-qPCR. Data are normalized to untreated samples (mean ± SEM; n = 3). **P < 0.01, t-test. NS indicates not significant.

