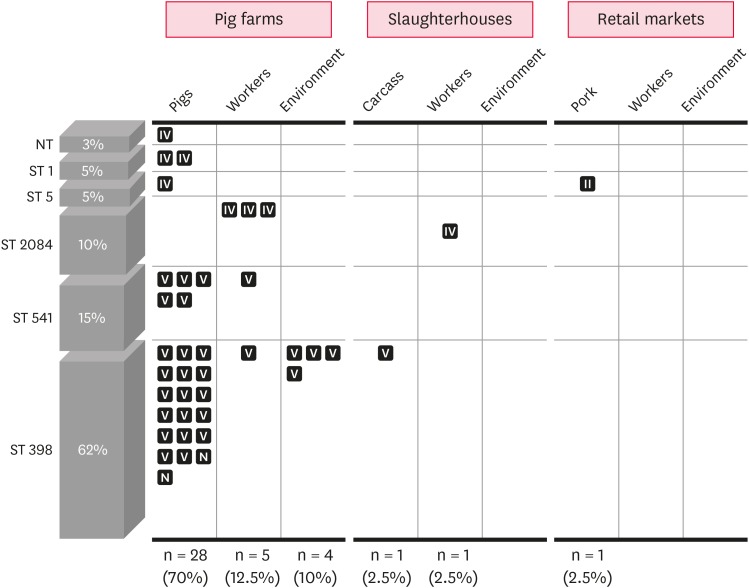
Fig. 1. Prevalence and genetic profiles of MRSA isolates recovered from pig farms, slaughterhouses, and retail markets. Each square represents individual MRSA isolate and staphylococcal cassette chromosome mec type II, IV, V, or N is shown in the square.
MRSA, methicillin-resistant Staphylococcus aureus; NT, non-typeable for multilocus sequence typing; ST, sequence type; N, non-typeable.

