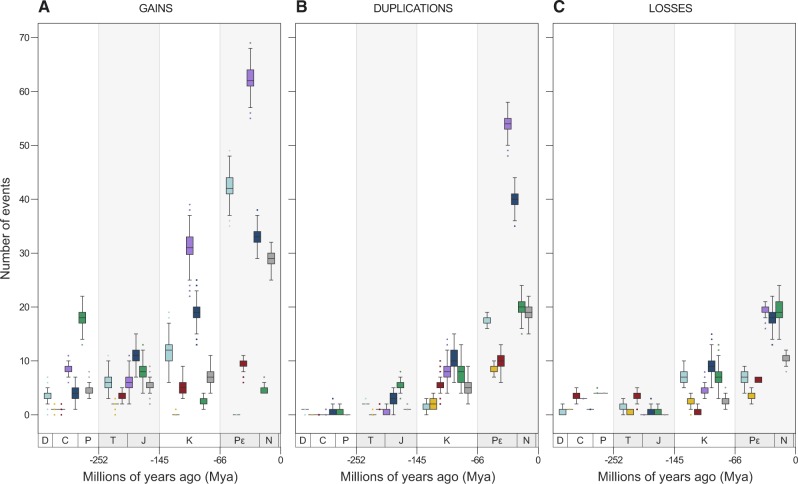
Figure 5.
Frequency of gains (A), duplications (B), and losses (C) of domains and molecular functions across four-time intervals. By performing 1,000 simulations, each event had its time of occurrence sampled randomly along the branch it belongs to, allowing the events shown in Fig. 4 to be split highlighting their frequency in four chronological bins: Devonian–Carboniferous–Permian (D–C–P); Triassic–Jurassic (T–J); Cretaceous (K); and Pε–N–Q. In this way, the scenario observed here summarizes the one shown in Fig. 1. Since the number of branches increases exponentially, absolute values at each bin in the subplots of Fig. 5 cannot be directly compared due to differences in scale. Therefore, the purpose of these plots is to highlight what events and domain functions were predominant at each interval.

