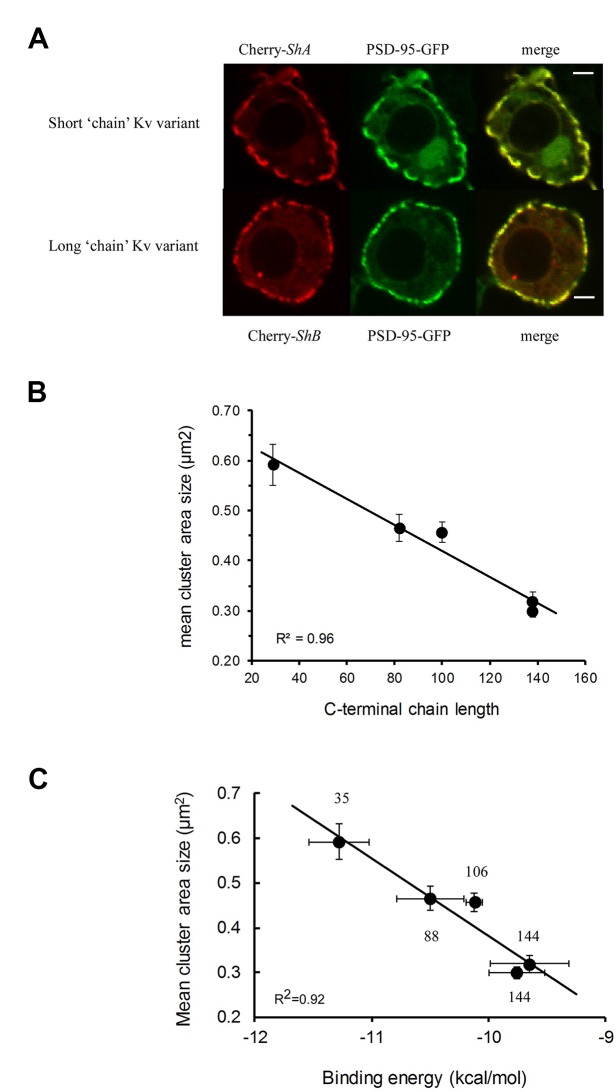
Figure 3.
Molecular and cellular correlates in PSD-95–mediated Kv channel clustering. (A) Typical confocal microscopy analysis of Drosophila Schneider S2 cells co-expressing PSD-95–GFP and either the short or long native (alternatively-spliced) Kv channel “chain” length variants. For each cell, three images are shown, with the red channel-associated and green PSD-95-associated fluorescence signals presented in the left and middle columns, respectively. The merged image is shown in the right column. Scale bars correspond to 2 μ;m. Numbers next to each channel notation indicate C-terminal amino acid “chain” length (adopted with permission from Zandany et al., 2015a). (B) Dependence of the mean mega-cluster area size of different Kv channel “chain” length variants on the C-terminal “chain” length. The solid curve corresponds to linear regression with an R2 value of 0.96. (C) Correlation plot relating the mean cluster area size of the different Kv channel “chain” length variants, as supported by PSD-95, and the binding affinity of the different variants to PSD-95. The solid curve represents linear regression between the compared quantities (R2 = 0.92). It is possible that such a linear correlation breaks down for too short “chains” due to steric considerations stemming from the inability of multiple Kv channel molecules to bind PSD-95 when the “chain” is too short. Numbers next to each channel notation indicate C-terminal “chain” length in terms of amino acid numbers. PSD, post-synaptic density.

