
Figure 4.
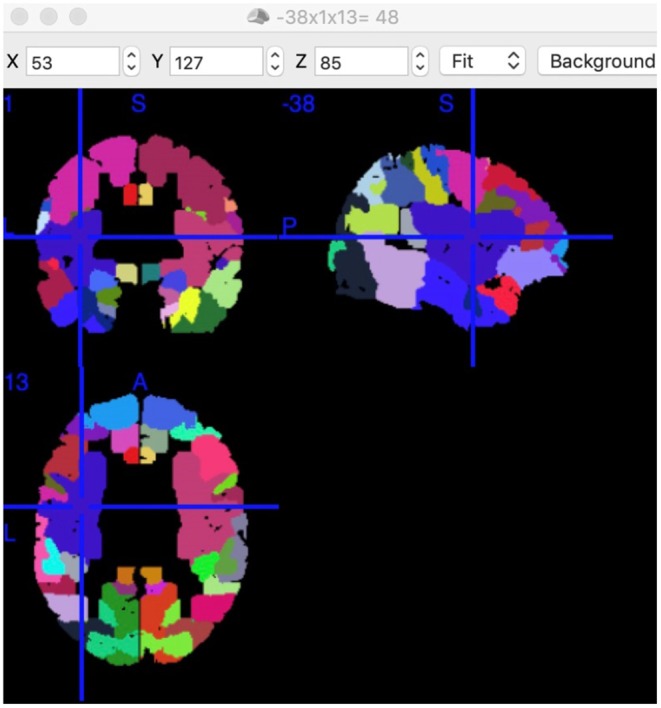
Position of Putamen and BA48. Position of BA48 had a center position on MNI: −38, 1, 13 in this study. Each colored area presents a functional node. This screenshot was captured using MRIcron (https://www.nitrc.org/projects/mricron).
Official websites use .gov
A
.gov website belongs to an official
government organization in the United States.
Secure .gov websites use HTTPS
A lock (
) or https:// means you've safely
connected to the .gov website. Share sensitive
information only on official, secure websites.
Position of Putamen and BA48. Position of BA48 had a center position on MNI: −38, 1, 13 in this study. Each colored area presents a functional node. This screenshot was captured using MRIcron (https://www.nitrc.org/projects/mricron).