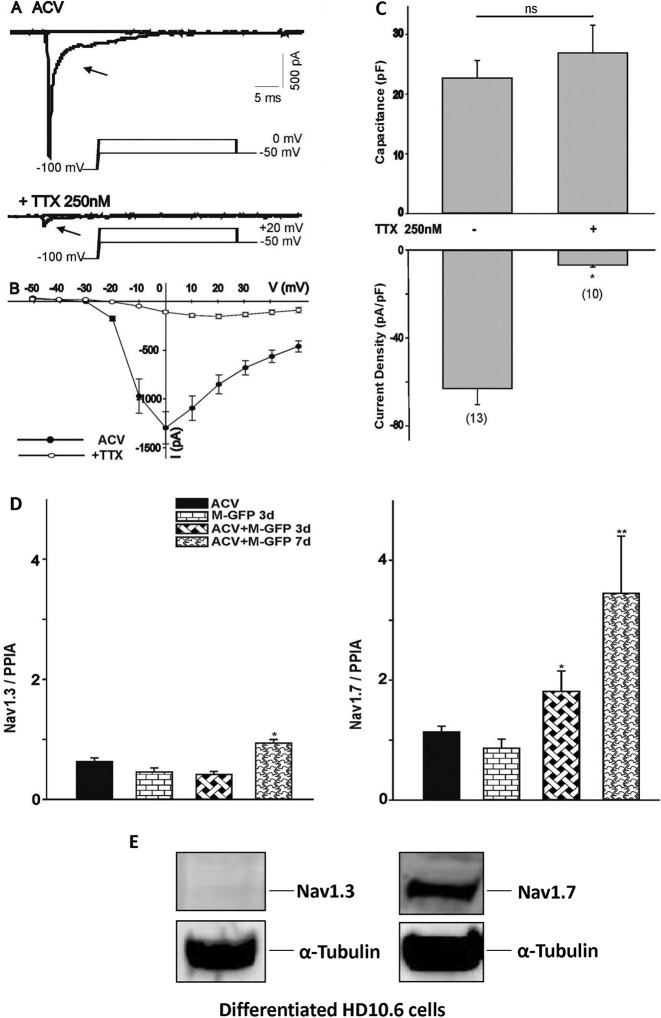
FIG 5.
Identification of voltage-gated Na+ channel subtypes in HD10.6 cells during HSV-1 infection. (A) The current traces of the ACV group generated by voltage steps to 0 mV from a holding potential of –100 mV were eliminated following TTX treatment. The peak currents were obtained by voltage steps to +20 mV after treatment with 250 nM TTX. (B) The current-voltage (I–V) relationship for the peak Na+ current amplitude in differentiated HD10.6 cells before and after TTX treatment was generated by a series of voltage steps from a holding potential of −100 mV. (C) Capacitance and Na+ current densities were compared between cells with or without TTX treatment. The asterisk (*) indicates a statistically significant difference (P < 0.05) from the ACV control. Numbers in parentheses indicate the number of cells recorded for each condition. ns, no statistically significant difference. (D) Nav1.3 and Nav1.7 expression was analyzed by qRT-PCR during latency establishment. Asterisks indicate significant differences (P < 0.05) from results for McKrae-GFP infection in the absence (*) or presence (**) of ACV at 3 dpi. (E) Nav1.3 and Nav1.7 protein expression was detected by Western blot analyses.

