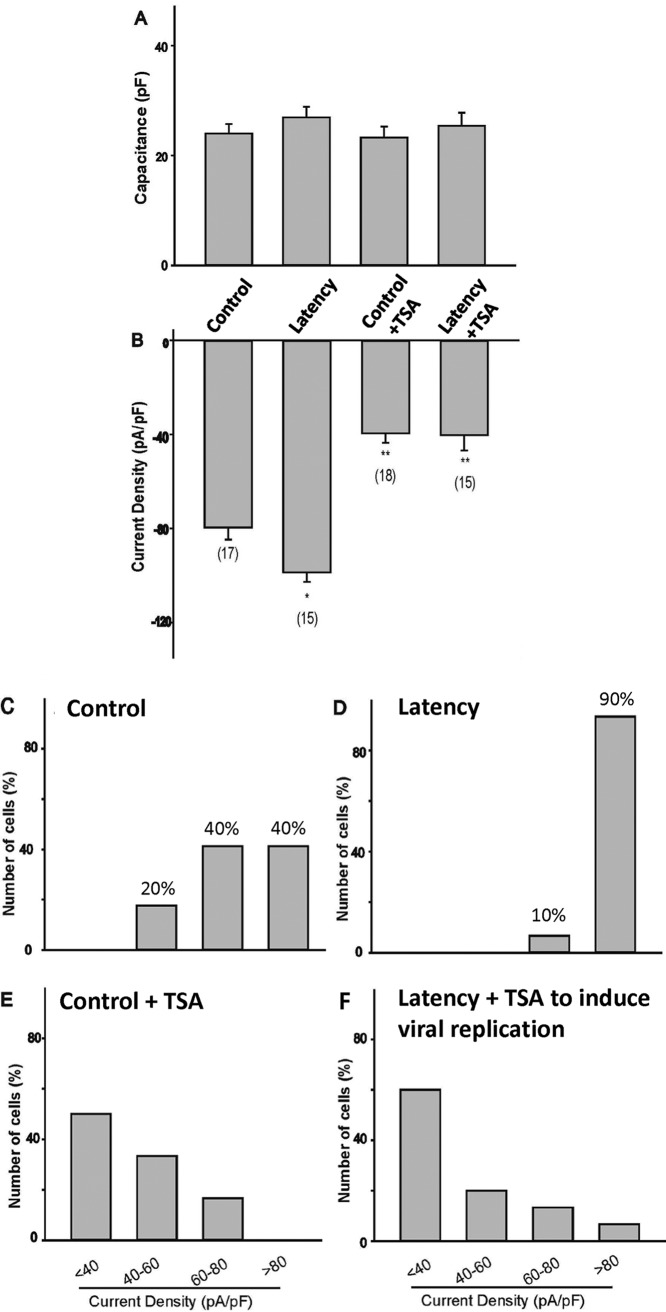
FIG 7.
Evaluation of VGSC activity during latency and after induced viral replication. Na+ currents of the whole cell were recorded to measure the activity. (A) Cell capacitance was measured and compared to that for controls. (B) Na+ current density was calculated based on the peak current and capacitance. Asterisks indicate statistically significant differences (P < 0.05) from the control (*) or the latent (**) group. Numbers in parentheses indicate the number of cells recorded for each condition. (C to F) Current density plots were analyzed to compare the VGSC activities of neurons in each group: control neurons (C), latent neurons (D), control neurons plus TSA (E), and latent neurons plus TSA (F). Note that for latent neurons, <0.02% of the cells had bright GFP, and these were regarded as failing to establish latency; none of our current recordings are from those bright GFP cells.

