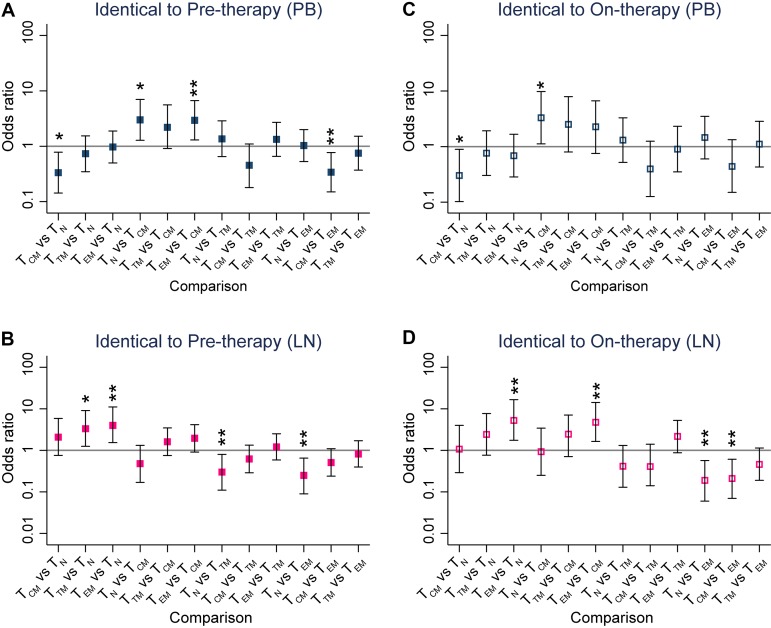
FIG 12.
HIV-1 genetic comparisons between pre- and on-therapy plasma samples and T cell subsets from each anatomic site. Shown are comparisons of the odds that an HIV-1 DNA sequence was genetically identical to HIV-1 RNA sequences derived from pretherapy (A and B) or on-therapy (C and D) plasma samples. The odds ratios were derived from every pairwise comparison between CD4+ T cell subsets sorted from PB (A and C) and LNs (B and D) obtained from the CHI group. The comparison of the odds is indicated as the OR, and the error bars indicate 95% confidence intervals of the ORs. *, P < 0.05; **, P < 0.01. p6-RT sequences were used for the genetic comparisons. The odds ratios and their confidence intervals were estimated by logistic regression models.

