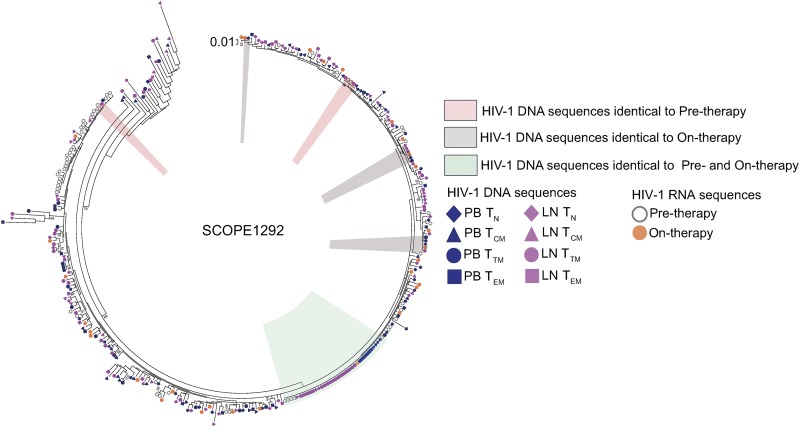
FIG 13.
Representative phylogenetic tree showing HIV-1 sequence comparisons between plasma and CD4+ T cell subsets. The phylogenetic regions containing HIV-1 DNA p6-RT sequences that were genetically identical to the viral sequences from the pretherapy plasma, to the on-therapy plasma, and to both of the plasma samples are marked. Individual HIV-1 DNA sequences derived from TN (diamonds), TCM (triangles), TTM (circles), and TEM (squares) cells sorted from PB (blue) and LNs (pink) are shown. Individual HIV-1 RNA sequences derived from pre- and on-therapy plasma are also shown. The maximum-likelihood phylogenetic tree was constructed with MEGA6.

