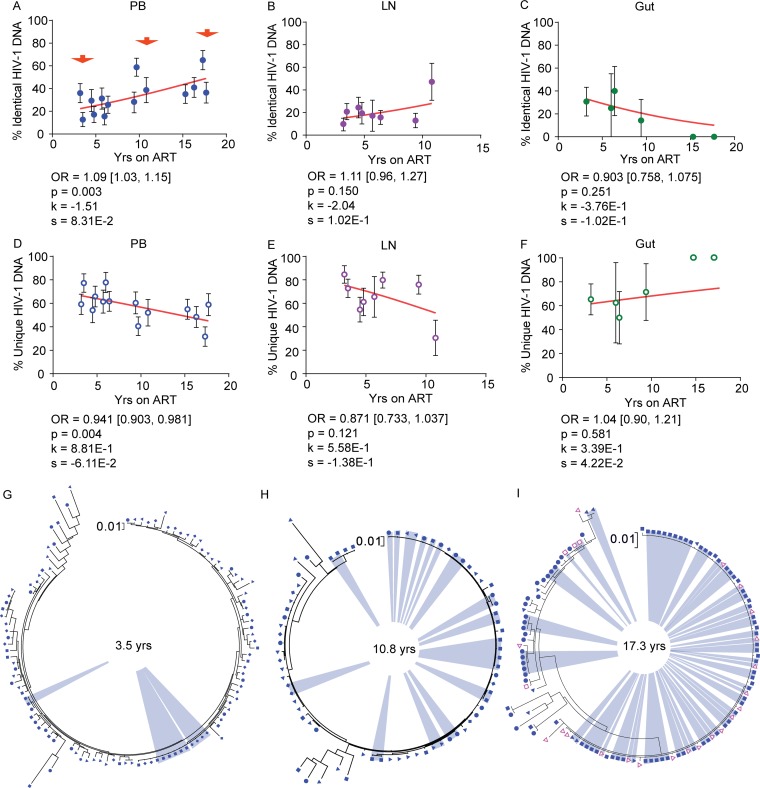
FIG 15.
Genetically identical and unique HIV-1 DNA sequences derived from anatomic sites during ART. (A to F) The associations of the percentages of identical (A to C) and unique (D to F) HIV-1 DNA p6-RT sequences with years on ART in PB (A and D), LN (B and E), and gut (C and F) tissues derived from the CHI group are shown. The effects of therapy duration on the odds that a viral sequence was genetically identical are indicated as OR per year on therapy. The 95% confidence intervals for ORs are indicated in square brackets. Estimated by mixed-effects logistics regression, the fitted curves (red lines) follow the following equation: y = 100 × {1 + exp[−(k + xs)]}−1, where y represents the proportions of genetically identical HIV-1 DNA p6-RT sequences, k represents the y intercept, s represents the coefficient calculated as log(OR), and x represents the years on ART. Each HIV-1 DNA sequence is the unit of analysis, and the denominator for each sequence is a single HIV-1-infected T cell (33, 73). The confidence interval of each data point was estimated from the binomial distribution. The confidence interval of each odds ratio was estimated by logistic regression models. (G to I) Maximum-likelihood phylogenetic trees indicating an increase in expansions of genetically identical HIV-1 DNA p6-RT sequences (blue) at 3.5 years (participant 1292) (G), 10.8 years (participant 2472) (H), and 17.3 years (participant 2013) (I) after ART initiation, as indicated in panel A (red arrows). The trees included HIV-1 DNA p6-RT sequences derived from TN (diamonds), TCM (solid triangles), TTM (circles), TEM (solid squares), X5+ R6− (open squares), and X5− R6+ (open triangles) cells sorted from PB.

