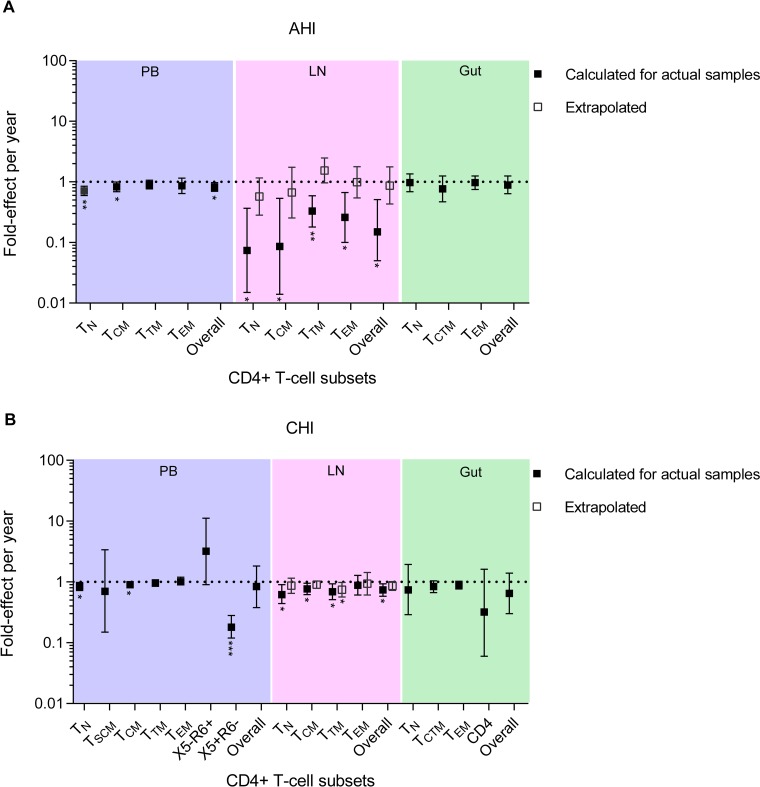
FIG 4.
Fold effect of infection frequency during each year on ART. Shown is the fold effect per year of therapy on infection frequency in a broad range of CD4+ T cell subsets sorted from PB (blue shading), LN (pink shading), and gut (green shading) tissues obtained from the AHI group (A) and the CHI group (B). The fold effect per year on therapy is a multiplicative effect that is equivalent to a fold change in the proportion of HIV-1-infected T cells from earlier to later time points during ART. For the LN, the fold effect per year on ART within 4 actual participant samples (with data from both PB and LNs) in the AHI group is indicated by the solid squares. The extrapolated fold effect per year on ART represents all 12 participants in the AHI group (open squares). For the LNs of the CHI group, the fold effect per year on ART derived from 8 actual participant samples (with data from both PB and LNs) is indicated by the solid squares, and the extrapolated fold effect per year of therapy for all 14 participants is indicated by the open squares. For each T cell subset, the fold effect per year on therapy was estimated when samples were available from at least 4 participants. The PB sample obtained from participant 2275 after 15.3 years of therapy was excluded from this cross-sectional analysis (Table 1). The error bars indicate the 95% confidence intervals of the infection frequency fold effect per year. *, P < 0.05; **, P < 0.01; ***, P < 0.001. The effects were estimated by negative binomial regression.

