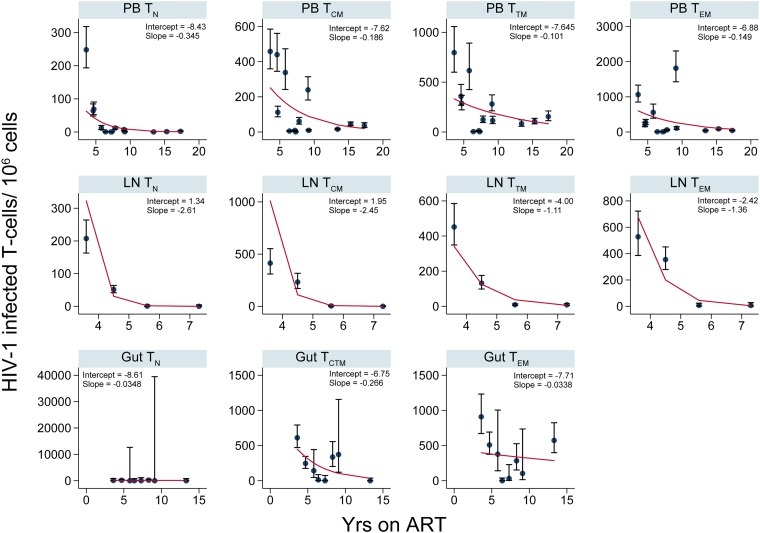
FIG 5.
Numbers of HIV-1-infected T cells per million over years on ART (AHI group). The numbers of HIV-1-infected cells per million within CD4+ T cell subsets sorted from PB, LNs, and gut are shown. The error bars indicate the 95% confidence interval for each point. The red lines are derived from the fitted values calculated using the following equation at the sampling time points: y = 1,000,000 × exp[intercept + slope × (years on ART)]. The coefficients (intercept and slope) used to derive the fitted values for each T cell subset sorted from an anatomic site are shown.

