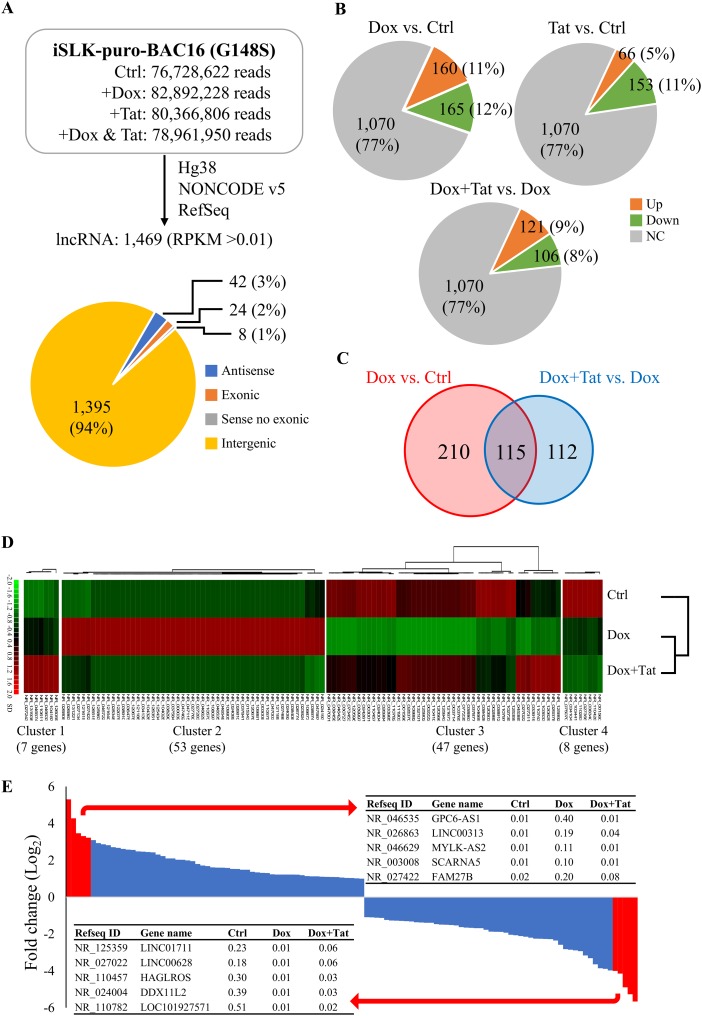
FIG 3.
HIV Tat-regulated lncRNAs in latent and lytic KSHV-infected SLK cells. (A) Summary of lncRNA data analysis. RNA-seq data from Fig. 1 was annotated to NONCODE v5.0 using the Partek Genomics Suite 7 (Partek). RPKM higher than 0.01 in at least one sample were considered expressed and subsequently converted to RefSeq IDs. The pie chart depicts the number of lncRNAs in each category. (B) Pie charts of lncRNA expression data from the three treatment conditions described in the legend for panel A. The numbers (percentages) of lncRNAs up- or downregulated more than 2-fold are shown. (C) Venn diagram of differentially expressed lncRNAs identified by Dox treatment (red) and by Dox-plus-HIV Tat treatment (blue), with Dox-treated cells as the control (Ctrl). (D) Heat map of hierarchical cluster analysis of the 115 lncRNAs shown in panel C that were differentially expressed under both Dox versus Ctrl and Dox-plus-HIV Tat versus Dox conditions. (E) Histogram of the fold change (log2) from Dox versus Ctrl of the 115 lncRNAs shown in panel C that were differentially expressed in both Dox versus Ctrl and Dox-plus-HIV Tat versus Dox conditions. The top 5 lncRNAs that were up- and downregulated by Dox treatment are listed according to their RPKM.

