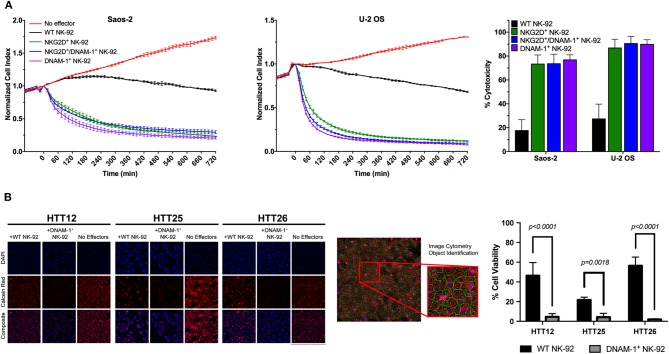
Figure 5.
Evaluation of NK cell cytotoxicity. (A) Representative results from cytotoxicity assays on Saos-2 (left panel) and U-2 OS (middle panel) cell lines using the xCelligence RTCA platform. Calculation of cytotoxic activity after 4 h of co-culture from two independent experiments (right panel) shows enhanced cytotoxic activity by GM NK cells. (B) Live tumor cells were loaded with Calcein-AM dye and co-cultured with effector cells at a 10:1 E/T ratio and incubated for 4 h. Live tumor cells were identified as Hoescht positive nuclei bounded by a Calcein Red positive cytoplasmic border. Apoptotic bodies were size excluded from the analysis. Tumor cell viability was assessed by determining the average fluorescent intensity (AFI) of individual tumor cells within each well. Percent viability was calculated by comparing the AFI of each condition to non-treated controls. Results are reported as the mean viability of two independent experiments, with three technical replicates per experiment and four fields of view per well. Results were analyzed using a two-way ANOVA with Tukey's post-hoc analysis in GraphPad Prism. DNAM-1+ NK-92 cells were found to significantly reduce the viability of primary sarcoma patient tumor cells, p < 0.0001 (HTT12, HTT26); p = 0.0018 (HTT25).

