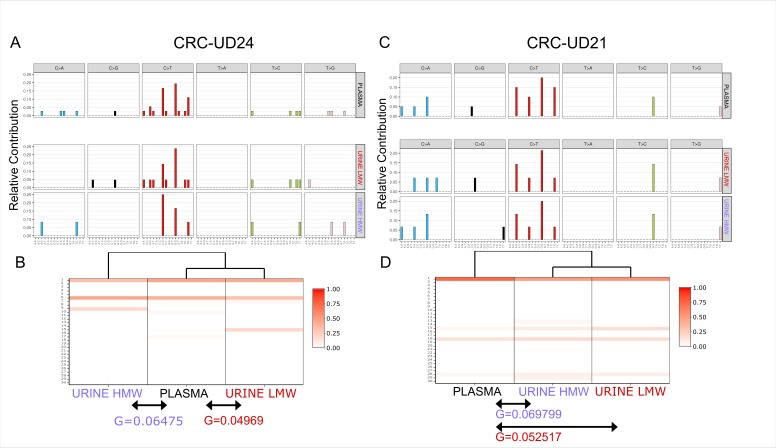
Figure 4.
Signature and mutational profiles of samples enriched for high and low molecular weight fragments. (A) and (C) Mutational profiles of enriched HMW and LMW urine samples and matched plasma ctDNA for cases CRC-UD24 (left) and CRC-UD21 (right). (B) and (D) Signature enrichment of HMW-enriched and LMW-enriched urine samples and matched plasma ctDNA is shown. Dendrogram is shown on the top, with a percentage indicating the similarity of each of the 30 signatures to the samples shown in the centre, while the G parameter (below the arrows) indicates the sum of the squares of differences between each signature observed in plasma ctDNA and the matched signatures in enriched HMW and LMW urine trtDNA samples. CRC, colorectal cancer; ctDNA, circulating free tumour DNA; HMW, high molecular weight; LMW, low molecular weight; trtDNA, trans-renal tumour DNA.

