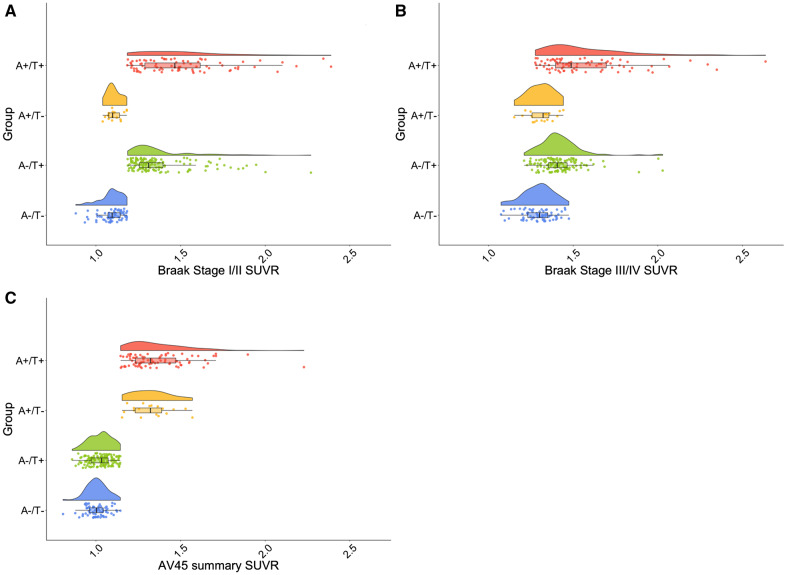
Figure 1.
PET SUVR distributions by A/T group. Raincloud plots depicting distributions of SUVR values for AV1451 Braak stage I/II (A), AV1451 Braak stage III/IV (B) and AV45 cortical summary index (C) across all A/T groups. A−/T− is denoted in blue, A−/T+ is denoted in green, A+/T− is denoted in orange and A+/T+ is denoted in red. One individual had an SUVR value of 3.46 for Braak I/II that was suppressed in all panels to improve the visualization of the rest of the data.

