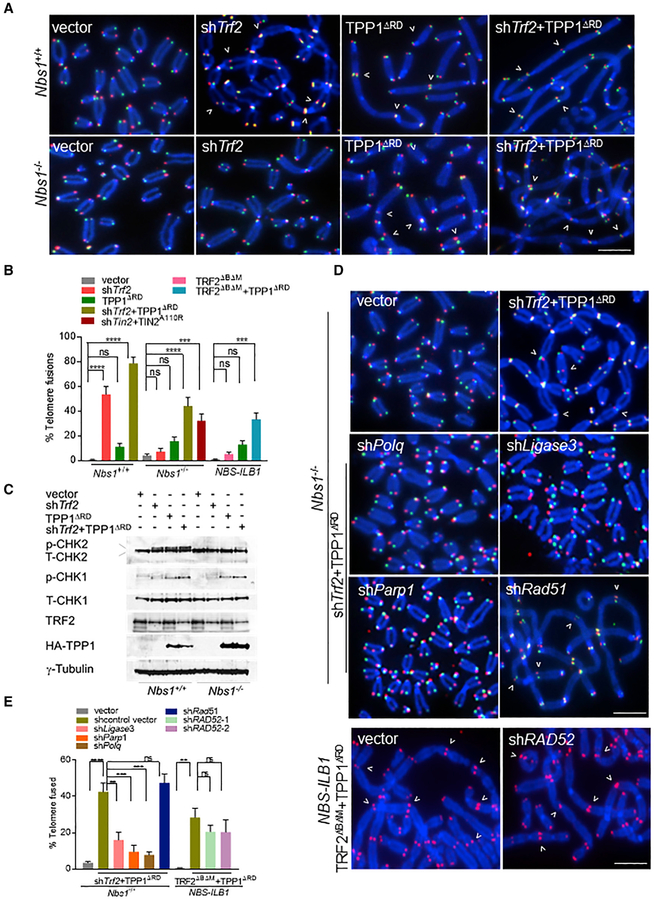
Figure 1. Telomeres Devoid of TRF2 and POT1-TPP1 Are Repaired in an MRN-Independent Manner.
(A) Nbs1+/+ and Nbs1−/− MEFs expressing the indicated DNA constructs for 120 h and TelG-FAM (green, leading-strand), TelC-Cy3 (red, lagging-strand), and DAPI (blue) were used to visualize fused chromosomes (arrowheads). Scale bar for all panels: 5 μm.
(B) Telomere fusion frequencies in NBS-ILB1 cells and in (A). Data are the average of 2 independent experiments ± SD from a minimum of 80 metaphases. ***p = 0.0002, ****p < 0.0001 by 1-way ANOVA. ns, non-significant.
(C) Immunoblot to detect total (T)-CHK1, T-CHK2, phosphorylated (p)-CHK1, and p-CHK2 in Nbs1+/+ and Nbs1−/− cells expressing indicated proteins. γ-Tubulin, loading control. NS, nonspecific band.
(D) Nbs1−/− MEFs and NBS-ILB1 cells expressed the indicated DNA constructs for 120 h. TelG-FAM (green), TelC-Cy3 (red), and DAPI (blue) were used to visualize fused chromosomes (arrowheads). Scale bar for all panels: 5 μm.
(E) Telomere fusion frequencies in (D). Data are the average of 3 independent experiments ± SD from a minimum of 120 metaphases. **p = 0.002, ***p = 0.0002, ****p < 0.0001 by 1-way ANOVA. Ns, non-significant.

