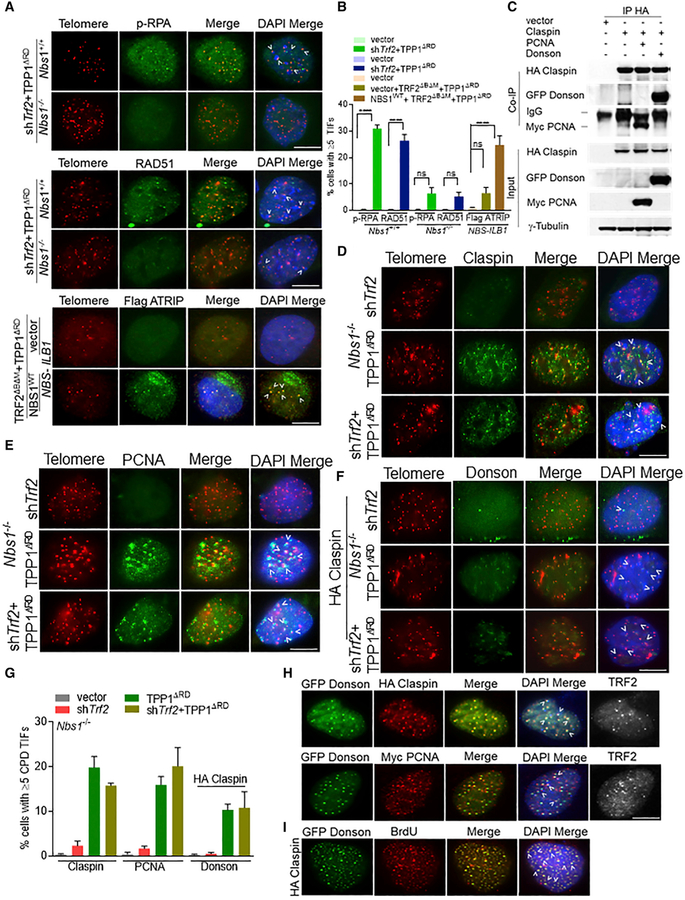
Figure 2. Recruitment of CPD to Telomeres Lacking TRF2 and POT1a/b-TPP1.
(A) Co-localization of p-RPA32, RAD51, and Flag-ATRIP with telomeres (arrowheads) in Nbs1+/+, Nbs1−/− MEFs, or NBS-ILB1 cells. Telomeres were visualized by peptide nucleic acid-fluorescent in situ hybridization (PNA-FISH) (red), indicated proteins (green), and nuclei (blue). Scale bar for all panels: 5 μm.
(B) Percentage of cells containing ≥5 TIFs in (A). Data are the mean of 2 independent experiments ± SD; n > 200 nuclei analyzed per experiment. ****p < 0.0001 by 1-way ANOVA. ns, non-significant.
(C) Co-IP of HA-Claspin with GFP-DONSON or Myc-PCNA in 293T cells. Input, 5% of the total cell lysate. γ-Tubulin, loading control.
(D–F) Localization of Claspin (D), PCNA (E), and DONSON (F) in Nbs1−/− MEFs expressing indicated DNAs. Endogenous DONSON TIFs were detectable only in HA-claspin-expressing cells. Telomeres were visualized by PNA-FISH (red), and endogenous CPD was visualized with the indicated antibodies (green). Scale bar for all panels: 5 μm.
(G) Percentage of cells containing ≥5 CPD+ foci co-localizing with telomeres, detected in (D)–(F).
(H) Co-expression of HA-Claspin with GFP-DONSON (top panel) or HA-Claspin, Myc-PCNA, and GFP-DONSON (bottom panel) in U2OS cells. Top panel: GFP-DONSON (green) and HA-Claspin(red). Bottom panel: Myc-PCNA (red) and GFP-DONSON (green). For bothpanels, anti-TRF2 antibody visualized telomeres (white).
(I) HA-Claspin and GFP-DONSON co-localized with BrdU+ foci in U2OS cells. GFP-DONSON (green), BrdU (red), and DAPI (blue). Scale bar for all panels: 5 μm.

