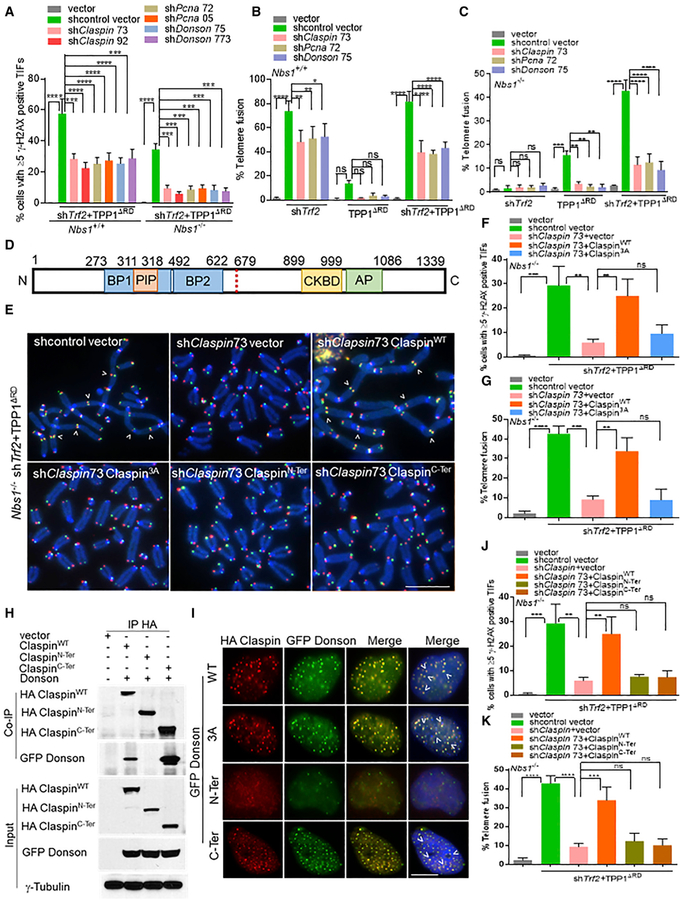
Figure 3. CPD Promotes A-NHEJ-Mediated Chromosome Fusions in the Absence of NBS1.
(A) Percentage of cells containing ≥5 γ-H2AX+ TIFs in Nbs1+/+ and Nbs1−/− MEFs expressing the indicated DNAs. Data are the mean of 3 independent experiments ± SD; n > 300 nuclei analyzed per experiment. ***p = 0.0002, ****p < 0.0001 by 1-way ANOVA.
(B) Telomere fusion frequencies in Nbs1+/+ cells treated with shTrf2, TPP1ΔRD, or both. Data are the average of 3 independent experiments ± SD from a minimum of 140 metaphases. *p = 0.01, **p = 0.001, ****p < 0.0001 by 1-way ANOVA. ns, non-significant.
(C) Telomere fusion frequencies in Nbs1−/− treated with shTrf2, TPP1ΔRD, or both. Data are the average of 3 independent experiments ± SD from a minimum of 140 metaphases. **p = 0.001, ***p = 0.0001, ****p < 0.0001 by 1-way ANOVA. ns, non-significant.
(D) Domain organization of Claspin. Replication fork-interacting domain, basic patch I, basic patch II, PCNA-interacting domain, CHK1-binding domain, and C-terminal acidic patch. The red dashed line separates ClaspinN-Ter (amino acids [aa] 1–679) and ClaspinC-Ter (aa 679–1,332).
(E) Nbs1−/− MEFs expressed the indicated DNA constructs for 120 h. TelG-FAM, TelC-Cy3, and DAPI-labeled metaphase spreads to visualize fused chromosomes (arrowheads). Scale bar for all panels: 5 μm.
(F) Percentage of cells containing ≥5 γ-H2AX TIFs observed in (E). Data are the mean of 2 independent experiments ± SD; n > 200 nuclei analyzed per experiment. **p = 0.01, ***p = 0.001, by 1-way ANOVA. ns, non-significant.
(G) Telomere fusion frequencies in (E). Data are the average of 2 independent experiments ± SD from a minimum of 70 metaphases. **p = 0.001, ***p = 0.0001, ****p < 0.0001 by 1-way ANOVA. ns, non-significant.
(H) Co-IP of HA-ClaspinWT, HA-ClaspinN-Ter, or HA-ClaspinC-Ter with GFP-DONSON in 293T cells. Input, 5% of the total cell lysate. γ-Tubulin, loading control.
(I) U2OS cells transiently transfected with HA-ClaspinWT, HA-Claspin3A, HA-ClaspinN-Ter, or HA-ClaspinC-Ter with GFP-DONSON for 48 h. GFP-DONSON (green), HA-Claspin (red), and DAPI to visualize nuclei (blue). Scale bar for all panels: 5 μm.
(J) Percentage of cells containing ≥5 γ-H2AX+ TIFs in Nbs1−/− MEFs infected with indicated DNA constructs. Data are the mean of 2 independent experiments ± SD; n > 200 nuclei analyzed per experiment. **p = 0.001, ***p = 0.0003 by 1-way ANOVA. ns, non-significant.
(K) Telomere fusion frequencies. Data are the average of 3 independent experiments ± SD from a minimum of 120 metaphases. ***p = 0.001, ****p < 0.0001 by 1-way ANOVA. ns, non-significant.

