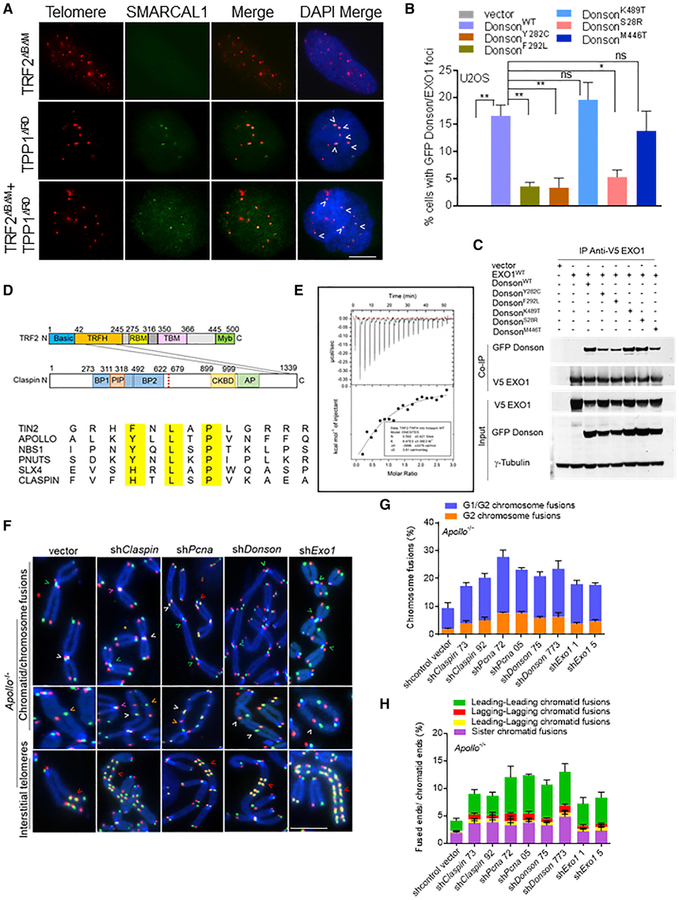
Figure 6. CPD and EXO1 Are Recruited by TRF2 to Dysfunctional Telomeres That Resemble Stalled Replication Forks.
(A) SMARCAL1 co-localizes with telomeres in U2OS cells expressing the indicated cDNAs. Telomere PNA-FISH (red), antibody staining (green), and DAPI (blue). Scale bar for all panels: 5 μm.
(B) Co-localization of GFP-DONSON and HA-Claspin with endogenous EXO1 at telomeres. Data represent the mean of 2 independent experiments ± SD; n > 150 nuclei analyzed per experiment. *p = 0.01, **p = 0.001 by 1-way ANOVA. ns, non-significant.
(C) WT GFP-DONSON or mutant DONSON interactions with V5-EXO1. Inputs represent 5% of the total cell lysate used for the IP. γ-tubulin, loading control.
(D) (Top) diagram illustrating that the TRF2TRFH domain interacts with the ClaspinTBM domain in its C terminus. (Bottom) representative proteins that contain the TBM (F/Y/H-X-L-X-P) are indicated.
(E) ITC measurements of the interaction between TRF2TRFH and ClaspinTBM peptides.
(F) Chromosome and chromatid fusions in Apollo/SNM1B−/− MEFs treated with indicated shRNAs for 120 h. TelG-FAM, TelC-Cy3, and DAPI were used to visualize fused chromosomes (arrowheads). Representative G1/G2 chromosome fusions (white arrows), G2 chromosome fusions (orange arrows), leading-leading strand (green arrows), sister-sister telomere fusion (pink arrows), and interstitial telomeres (red arrows) are indicated. Scale bar for all panels: 5 μm.
(G) Quantification of G1/G2 and G2 chromosome-type fusions in (F). Data represent the mean of 2 independent experiments ± SD from a minimum of 50 metaphases analyzed per experiment.
(H) Quantification of the chromatid-type and sister fusions in (F). Data represent the mean of 2 independent experiments ± SD from a minimum of 50 metaphases analyzed per experiment.

