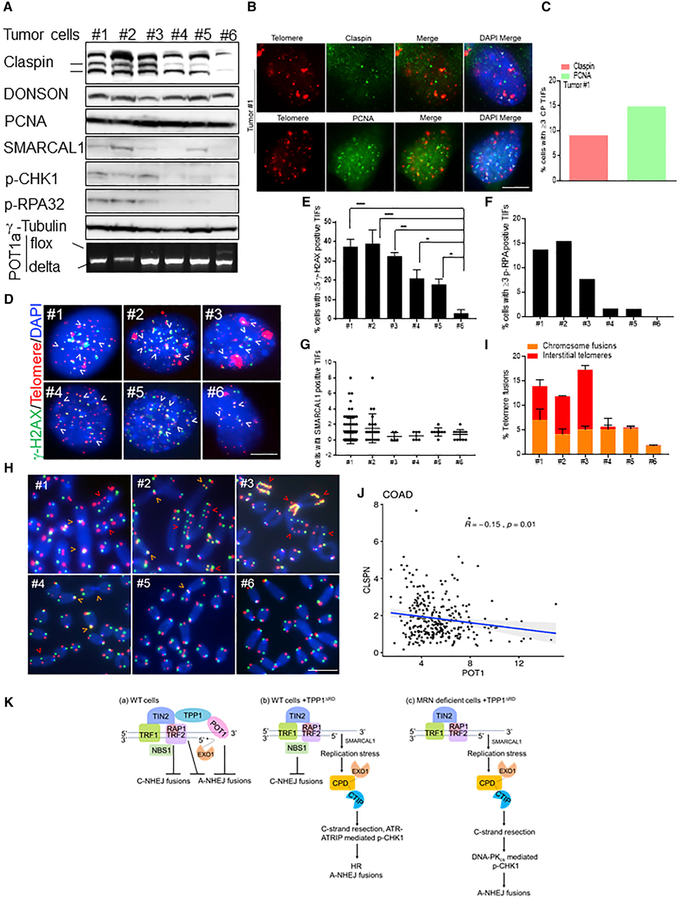
Figure 7. Genomic Instability in Tumors Derived from MMTV-Cre; p53F/F; Pot1aF/F Mice.
(A) CPD, SMARCAL1, p-CHK1, and p-RPA32 expression in MMTV-Cre; p53Δ/Δ; Pot1aΔ/Δ breast tumors (#1, 3, and 4), sarcoma (#2), and salivary gland tumor (#5). Tumor #6 is MMTV-Cre; p53Δ/Δ; Pot1aF/ΔΔ. γ-Tubulin, loading control. Bottom panel: PCR genotyping.
(B) Detection of Claspin and PCNA (green) and telomeres (red) in tumor #1.
(C) Percentage of cells containing ≥3 Claspin/PCNA (CP+) TIFs in (B). Scale bar for all panels: 5 μm.
(D) γ-H2AX TIFs in tumor cell lines. Telomere PNA-FISH (red), antibody staining (green), and nuclei (blue). Scale bar for all panels: 5 μm.
(E) Percentage of cells containing ≥5 γ-H2AX TIFs in (D). Data represent the mean of 2 independent experiments ± SD; n > 200 nuclei analyzed per experiment. *p = 0.01, **p = 0.001, ***p = 0.0001 by 1-way ANOVA.
(F) Percentage of cells containing ≥3 p-RPA32 TIFs in tumor cell lines.
(G) SMARCAL1 TIFs in tumor cell lines.
(H) Interstitial telomeres (red arrow), chromosome and sister chromatid fusions (orange arrow) in Pot1a deleted mouse tumor cell lines. TelG-FAM, TelC-Cy3, and DAPI were used to visualize fused chromosomes. Scale bar for all panels: 5 μm.
(I) Quantification of the number of interstitial telomeres and chromosome fusions in (H). Data represent the average of 2 independent experiments ± SD from a minimum of 70 metaphases.
(J) Spearman’s correlation between claspin and POT1 gene expression in colon adenocarcinoma obtained from TCGA data.
(K) Schematic depicting CPD functions. See text for details.

