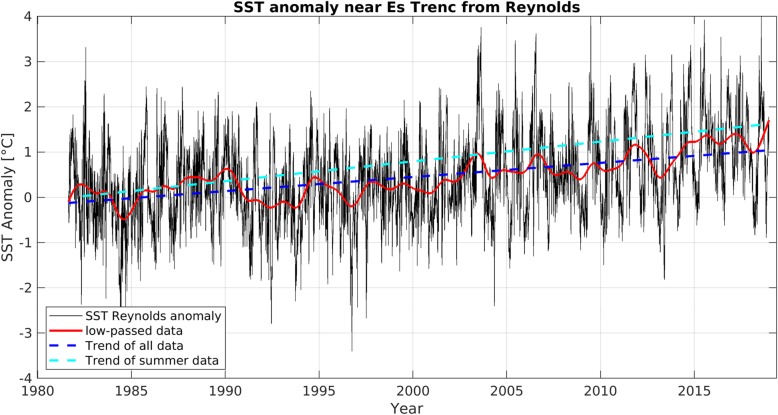
Fig. 2.
SST anomaly off the southern coast of Mallorca 1982–2018. SST anomaly (black) off the southern coast of Mallorca, with the low-passed data (> 1.6 years, red), the linear warming trend of all data (blue broken line), and the warming trend in the summer months (June, July and August, light blue line). For Methods see Additional file 1

