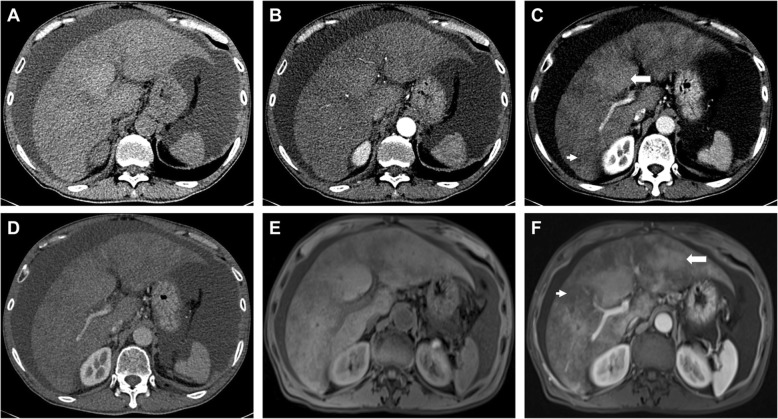
Fig. 2.
Elderly male patients diagnosed with gynura segetum-induced HSOS received contrast-enhanced CT and MRI scan. a-d images of plain and contrast-enhanced CT scan; a plain CT scan; b arterial phase; c porta-venous phase; patchy liver enhancement (arrow) and heterogeneous hypoattenuation (arrowhead) were shown; d equilibrium phases. e-f: images of pre-contrast and portal-venous phase on dynamic contrast-enhanced MRI scan;e pre-contrast MRI scan; f portal-venous phase of MRI scan. Heterogeneous hypointensity (arrowhead) and patchy enhancement (arrow) were shown

