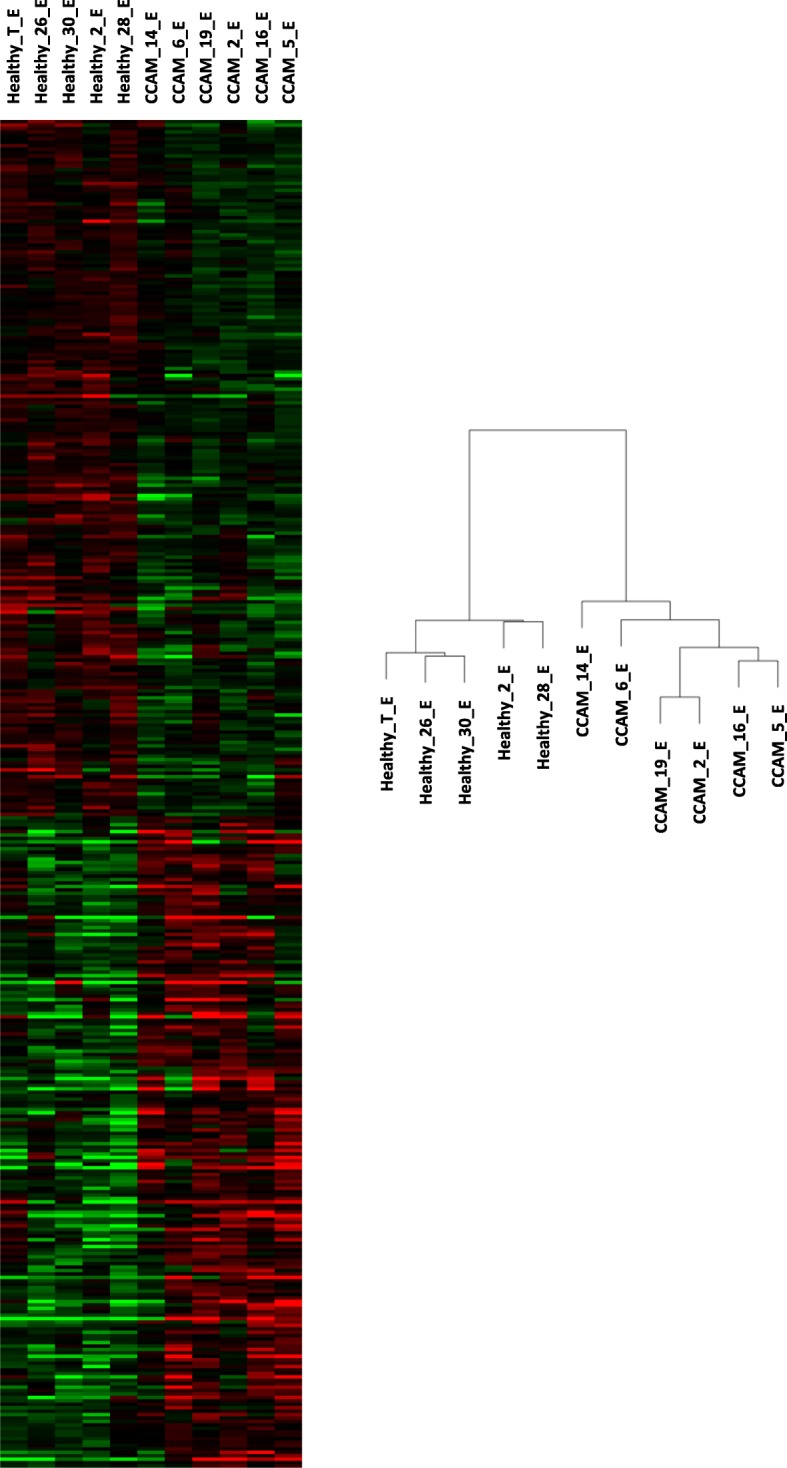
Fig. 2.

Unbiased clustering of genes based on their levels of expression in microarray analyses of epithelial samples from six cystic and five control areas. Samples CCAM_2_E, CCAM_6_E and CCAM_19_E are type I CCAM; samples CCAM_5_E, CCAM_14_E and CCAM_16_E are type II CCAM. The cluster correlation dendrogram showed a clear separation of CCAM samples from control samples. No clear clustering differentiated type I CCAM from type II CCAM
