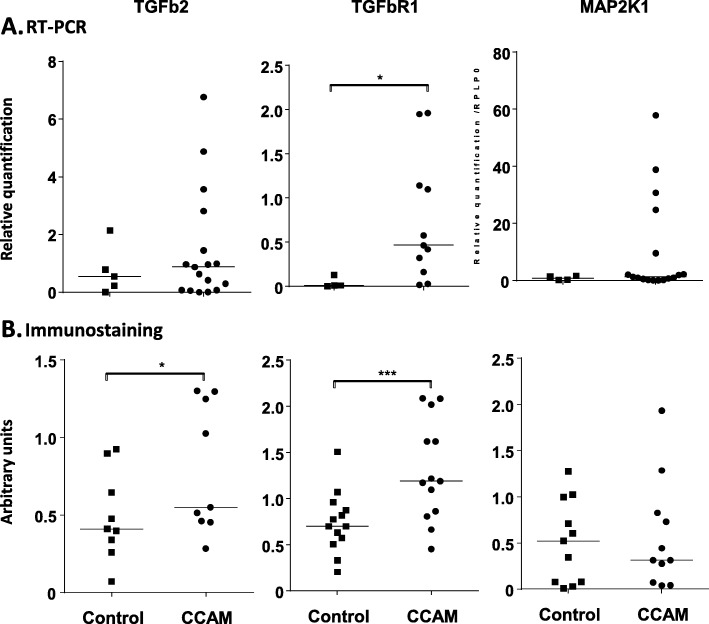
Fig. 5.
RT-PCR (a) and immunostaining (b) results for TGFb2, TGFbR1 and MAP 2 K1 in control and CCAM samples. TGFB2: 5 controls vs. 17 CCAM samples and 9 controls vs. 9 CCAM samples for RT-PCR and immunostaining, respectively; TGFBR1: 4 controls vs. 11 CCAM samples and 13 controls vs. 13 CCAM samples for RT-PCR and immunostaining, respectively; MAP 2 K1: 4 controls vs. 17 CCAM samples and 13 controls vs. 11 CCAM samples for RT-PCR and immunostaining, respectively. * p < 0.05; ***p < 0.001

