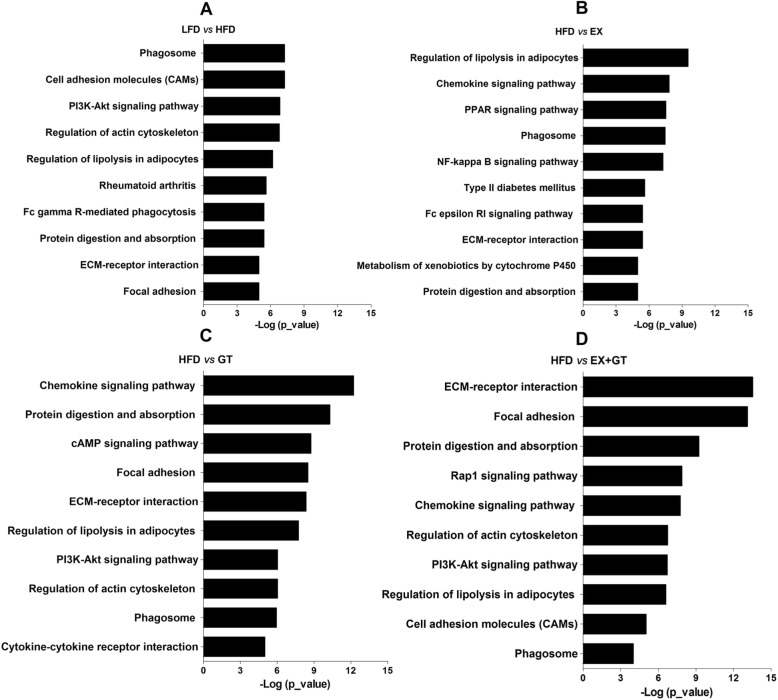
Fig. 7.
Overview of KEGG annotation of all DEGs identified by the RNAseq analysis on mice muscle tissues treated with GT, Ex or GT + Ex for 8 weeks. Notes: The top 10 KEGG terms identified in the comparisons are reported. X axis represents the p-values in log 10 scale. Y axis represents functional classification of KEGG. LFD mice versus HFD mice (a), HFD mice versus HFD mice plus exercise (b), HFD mice versus HFD mice feeding with HFD supplement with YKGT (c), and HFD mice versus HFD mice feeding with HFD supplement with YKGT and exercise (d)

