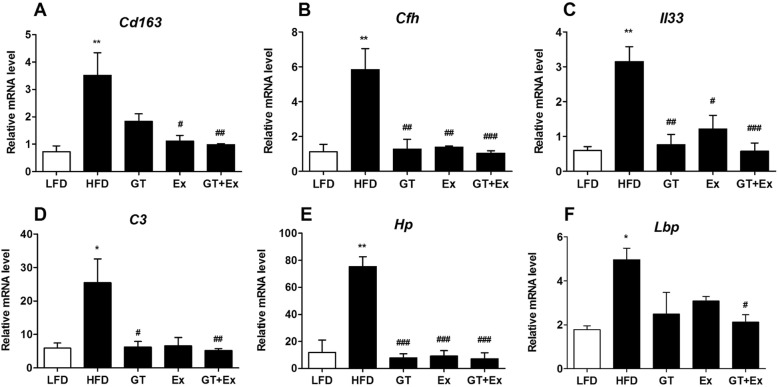
Fig. 8.
The inflammatory response gene expression was quantified by FPKM in the muscle tissue of various group mice. Notes: LFD, LFD feeding mice; HFD, HFD feeding mice; GT, HFD with YKGT supplement feeding mice; EX, HFD feeding with exercise mice; GT + Ex, HFD with YKGT supplement feeding and exercise group mice. The mRNA levels of Cd163 (a), Cfh (b), IL33 (c), C3 (d), Hp (e), Lbp (f) are showing. Values are means ± SE, n = 3. *P < 0.05, **P < 0.01 when compared to LFD, #P < 0.05, ##P < 0.01, ###P < 0.001 compared to HFD

