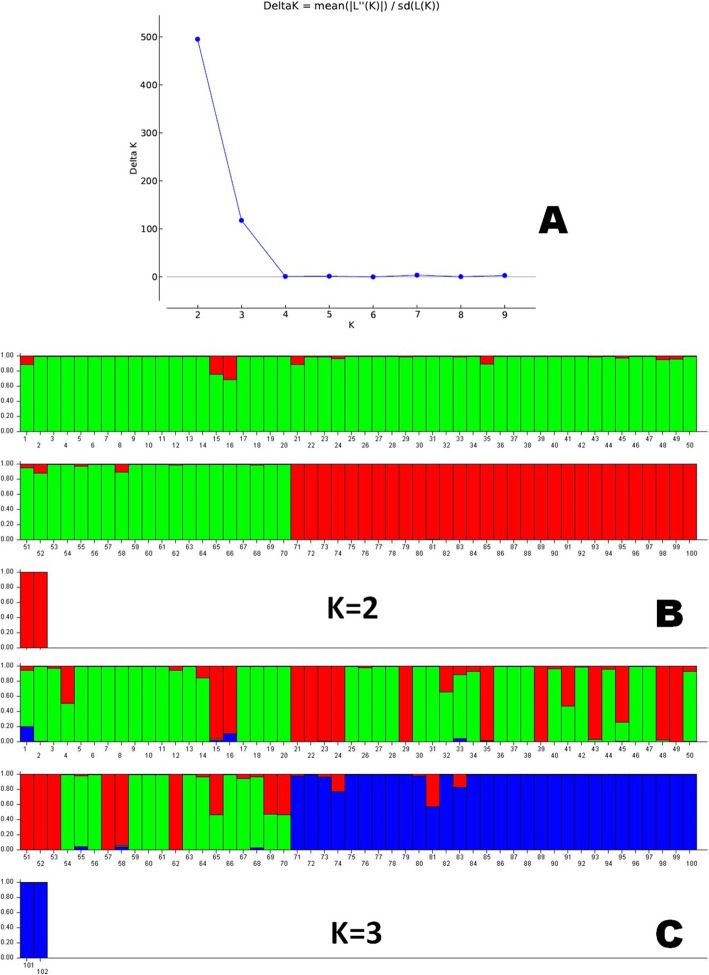
Fig. 3.
a Graph of delta K value, an ad-hoc statistic related to the rate of change in the log probability of data between successive K values; b Population structure of the 102-panel population placed based on membership probability fractions of individual genotypes at K = 2 and c Population structure of the 102-panel population placed based on membership probability fractions of individual genotypes at K = 3. The genotypes with the probability of ≥80% membership fractions were assigned to corresponding subgroups with others categorized as admixture. The numbers in the figure represent the serial number of the genotypes enlisted in Table 1

