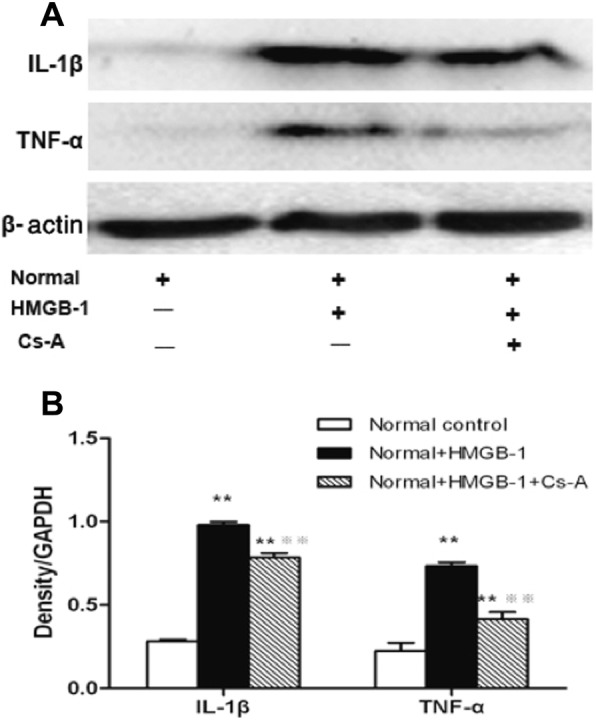
Fig. 4.

Retinal protein levels of IL-1β and TNF-α with HMGB-1
treatment. Western blot was performed to determine the retinal protein expression of.
IL-1β and TNF-α in the Normal control, Normal+HMGB-1 and Normal+HMGB-1 + Cs-A group. (a) Representative protein immunoblots of IL-1β and TNF-α in retinal tissue. Equal amounts of proteins were loaded and β-actin was used as a loading control, n = 4 experiments. (b) Column diagrams and bars representing the ratio of the scanned immunoblots of IL-1β and TNF-α to that of β-actin, respectively. Data are mean ± SD, n = 4 experiments, **p < 0.01 vs. Normal control group, and ※※p < 0.01 vs. Normal+HMGB-1 group.
