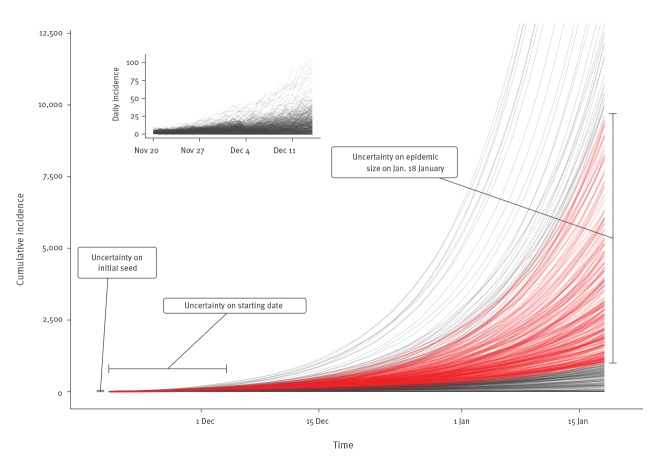
Figure 2.
Illustration of the simulation strategy, 2019 novel coronavirus outbreak, China, 2019–2020
The lines represent the cumulative incidence of 480 simulations with R0 = 1.8 and k = 1.13. The other parameters are left to vary according to the Table. Among these simulated epidemics, 54.3% led to a cumulative incidence between 1,000 and 9,700 on 18 January 2020 (in red).

