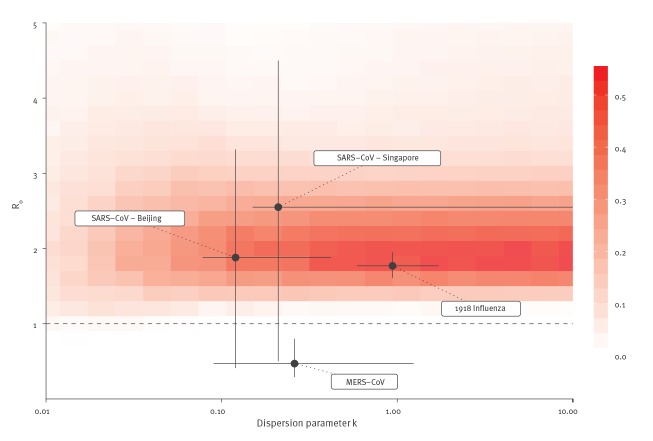
Figure 3.
Proportion of simulated epidemics that lead to a cumulative incidence between 1,000 and 9,700 of the 2019 novel coronavirus outbreak, China, on 18 January 2020
MERS: Middle East respiratory syndrome-related coronavirus; SARS: severe acute respiratory syndrome-related coronavirus.
This can be interpreted as the combinations of R0 and k values most compatible with the estimation of epidemic size before quarantine measures were put in place. As a comparison, we show the estimates of R0 and k for the early human-to-human transmission of SARS-CoV in Singapore and Beijing and of 1918 pandemic influenza [7,9,14].

