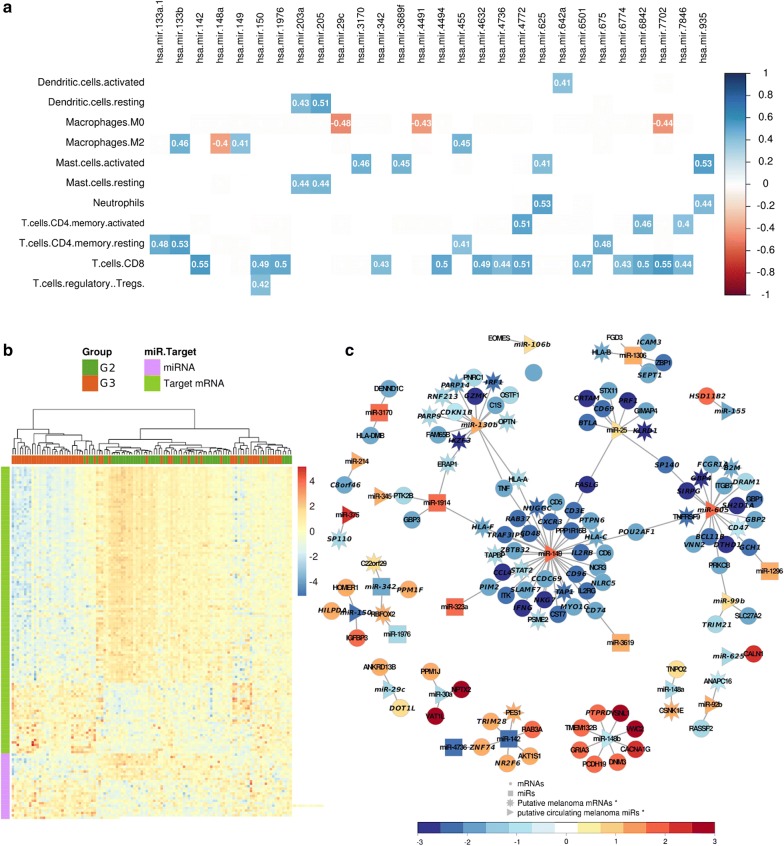
Fig. 3.
Differentially expressed miRNA/mRNA (MTG) pairs impact the overall survival of melanoma patients. a Pearson correlation matrix between immune cell types and differentially expressed miRNAs (DEM). Only correlation with abs(r) ≥ 0.4 and p-value ≤ 0.05 are shown. The immune cell types enriched in G2 and the miRNAs upregulated in G2 are highlighted in green and those in G3 in orange. b Heat map showing the expression pattern of miRNAs and target genes among samples, which were hierarchical clustered using distance as 1 − Pearson correlation coefficient. Data represent RNA-seq normalized pseudocounts in log2 scale, z-score transformed by rows. c Network highlighting the interactions between MTG pairs. The putative circulating miRNAs reported by miRandola are identified as triangles and their targets as stars. Gene expression in melanoma cells was accessed in the CCLE database. Node colors represent the gene expression levels in G3 related to G2. All genes in the network labeled in italic have an impact on patients’ survival

