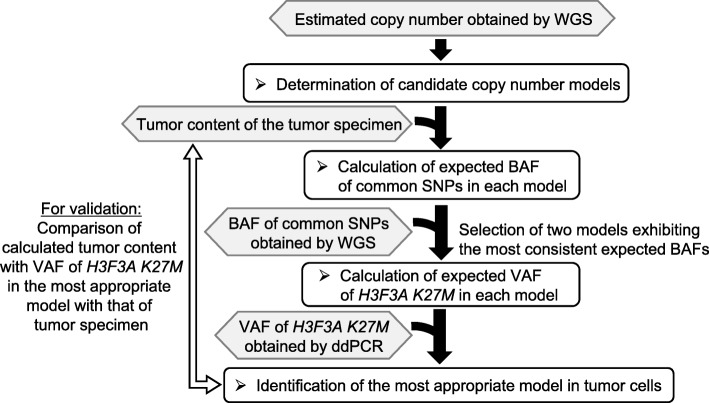
Fig. 2.
Flowchart for the identification of the most appropriate chromosomal structure model. Using the total copy number of chromosome 1 obtained by WGS, tumor content of the tumor specimen (H3 K27M positive cells/DAPI positive cells in IHC), BAF of common SNPs obtained by WGS, and VAF of H3F3A K27M obtained by ddPCR, we identified the most consistent chromosomal structure model. Then, we calculated the tumor content with VAF of H3F3A K27M in the most appropriate model and compared the calculated tumor content with that of the tumor specimen obtained by IHC for validation

