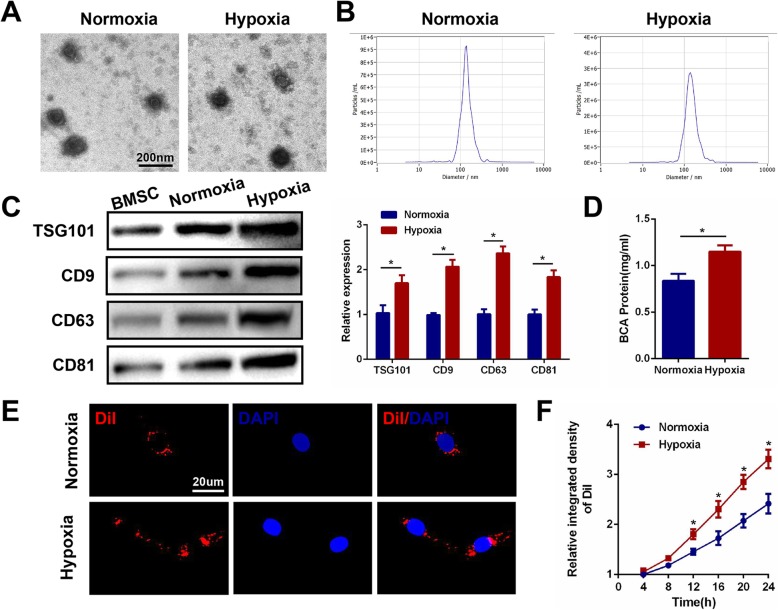
Fig. 1.
Hypoxia promotes exosome release from MSCs. a Morphology of Exos and HExos under TEM. b NTA analysis of Exos and HExos revealed that exosomes from the two groups exhibit similar size ranges (50–150 nm). c Western blot analysis of exosomal proteins including TSG101, CD9, CD63 and CD81. d Exosome protein concentration in the two groups using the BCA assay. e Uptake of the red fluorescence dye Dil-labeled Exos and HExos into BV2 microglia. f Statistical evaluation of fluorescence intensities in the two groups. *P < 0.05

