Fig. 4.
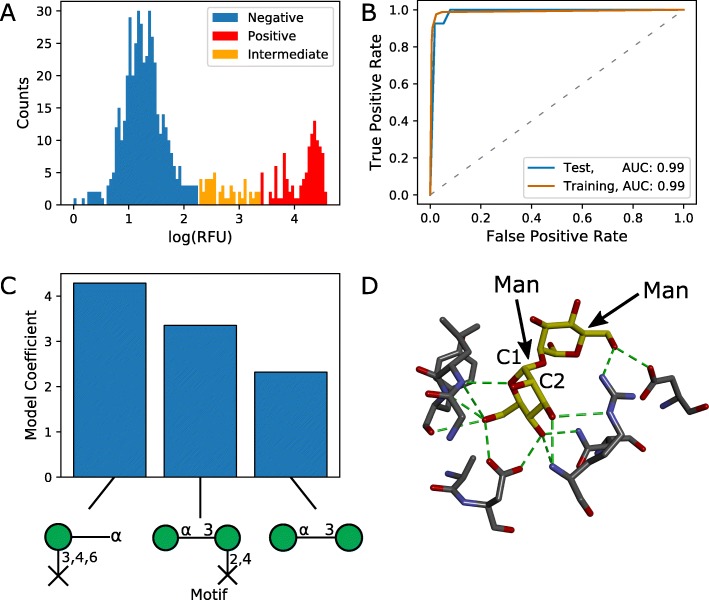
Predicted carbohydrate-binding motifs of Con A from CFG glycan microarray data. a Distribution of RFUs and classification of non-binding (blue), intermediate binding (orange), and binding glycans (red). b ROC curves for the test (n=141) and training (n=421) sets. The ratio of negative to positive samples was 4.1. c Logistic regression coefficients for identified motifs. d The intermolecular hydrogen bonding interactions (shown in green) between 2 α-mannobiose (carbon backbone shown in yellow) and the carbohydrate-binding domain of Concanavalin A (carbon backbones shown in grey). Reproduced from an X-ray crystal structure at 1.2 Å resolution available at the Protein Data Bank (PDB: 1I3H) [52]. See Additional file 1 for a detailed notation key

