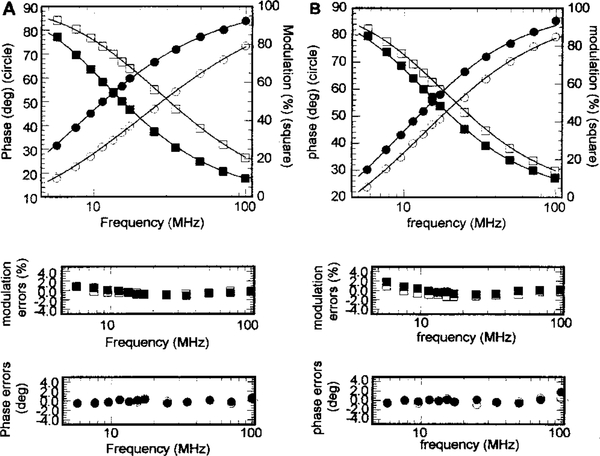
Figure 3:
Frequency domain phase and modulation data for AEDANS-labeled TnI Cys-117 in reconstituted thin filaments in the (A) absence of Ca2+ and (B) presence of Ca2+: (black symbols) donor only and (white symbols) donor and acceptor. The phase angle increases and the modulation decreases as the frequency increases. In the presence of the acceptor, the lifetime decreases; thus, the frequency responses shift to higher frequencies. The solid lines are the best fitted curves for distance distribution analysis.

