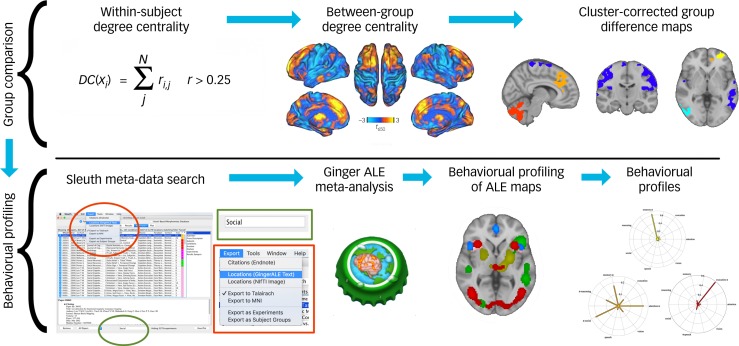
Fig. 1.
Behavioural profiling pipeline using degree-centrality difference maps as ROIs.
Degree centrality group difference maps of hyperconnectivity and hypoconnectivity served as ROIs for behavioural profiling, generating one radially plotted behavioural profile per group difference cluster. ROIs were input to the Sleuth application (first image in the Behavioural Profiling row)6 and meta-data were filtered with Sleuth's filter tool created at our request (available in v3.0a2 and above). The domain ‘social’ is shown as an example of a behavioural domain with which the workspace can be filtered (highlighted in green). Domain-specific workspaces were exported (highlighted in red) for GingerALE meta-analysis, and activation likelihood maps determined the degree of functional bias towards behavioural domains within the ROI's behavioural profile. The degree centrality equation was adapted from Zuo et al7 and the description from Holiga et al.8 ALE, activation likelihood estimation; ROI, region of interest.

