Fig. 2.
Behavioural profiling of ALE maps.
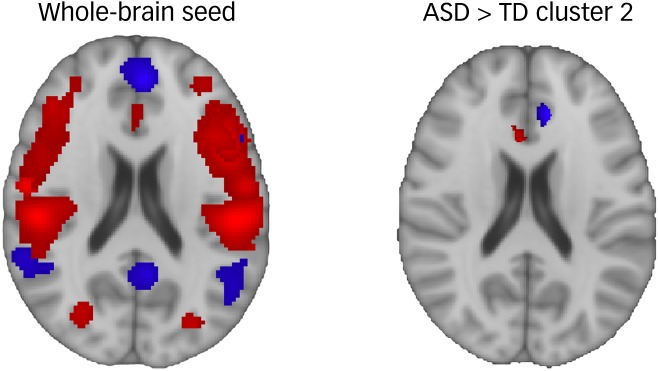
ALE maps for each of 30 behavioural domains are overlaid for the whole-brain maps and hyperconnectivity cluster 2 maps, with the blue ALE maps corresponding to the ‘social’ behavioural domain, and for all other behavioural domain ALE maps shown in red. The proportion of behavioural domain representation is computed based on the sum of all voxels in the ALE map, and the spatial extent of the ALE maps in the images can be used to roughly visualise the proportion. Hyperconnectivity (ASD > TD) cluster 2 is used here as an example to depict the relationship between ALE maps and behavioural profile proportions. It can be seen that the social ALE map is represented in large proportion compared with the other ALE maps in hyperconnectivity cluster 2 (right image) and that the social ALE map is in higher proportion in hyperconnectivity cluster 2 than the social ALE map in the whole-brain seed (left image). The large proportion compared with within-cluster ALE maps demonstrates that social behaviour is dominantly represented in hyperconnectivity cluster 2, and the higher proportion compared to the social ALE map in the whole-brain seed depicts the significant overrepresentation of social behaviour in hyperconnectivity cluster 2. ALE, activation likelihood estimation; ASD, autism spectrum disorder; TD, typically developed.

