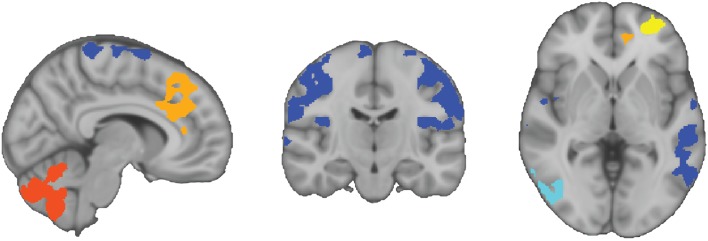
Fig. 3.
Autism spectrum disorder hyperconnectivity and hypoconnectivity clusters.
Hyperconnected clusters are highlighted in warm colours (yellow = cluster 1, orange = cluster 2, red = cluster 3), and hypoconnected regions are highlighted in cool colours (light blue = cluster 1, dark blue = cluster 2). All hyper/hypoconnectivity overlays are in binary format, and the colours are only used to distinguish the clusters. Sagittal, coronal and axial slices in the image correspond to x = 8, y = −17 and z = −1 in MNI152 coordinates.

