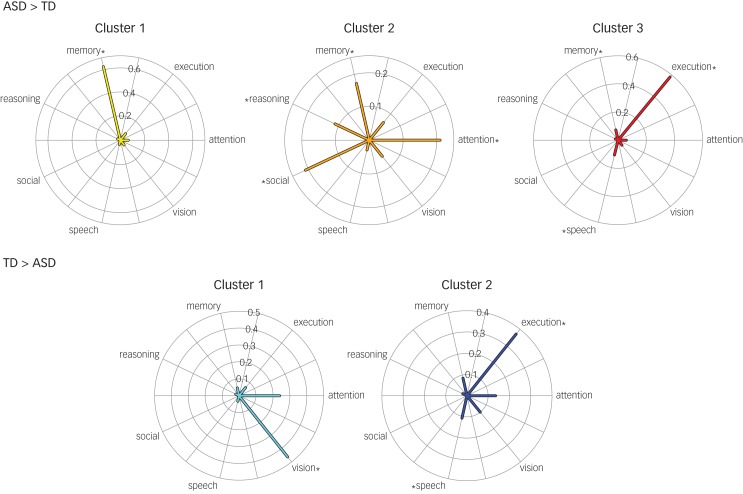
Fig. 4.
Behavioural profiles for each hyperconnectivity and hypoconnectivity cluster.
Behavioural domains that reached significance in any of the five clusters are listed on each of the radial plot's axes, and the value along the axis through which the line segments extend indicates the proportion of the brain region's involvement in the behavioural domain. The behavioural profiles visualise the overrepresented behavioural domains in each cluster. Asterisks next to behavioural domains denote significant functional biases within the cluster (P < 0.0001). TD, typically developed; ASD, autism spectrum disorder.

