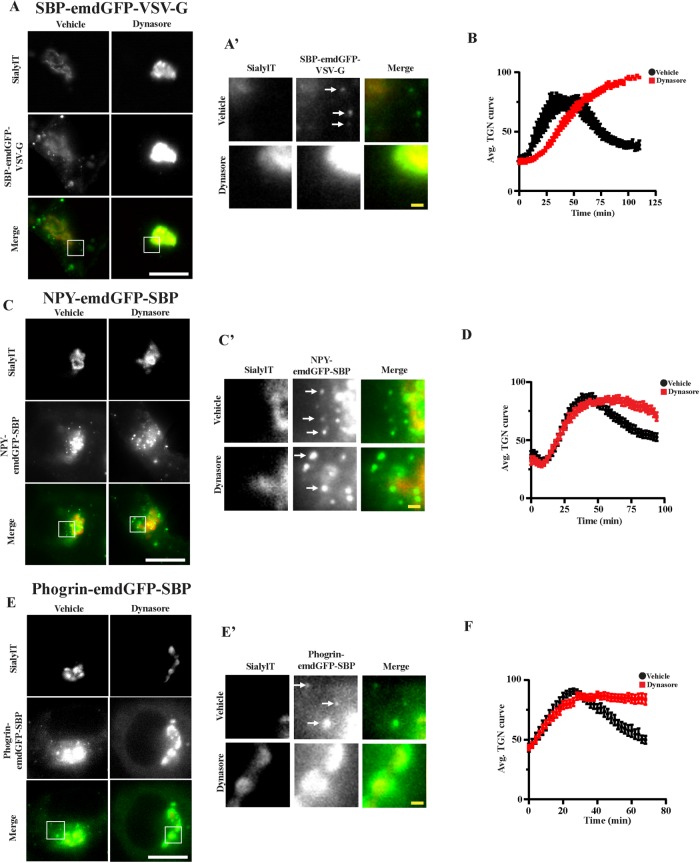
FIGURE 4:
INS-1 cells transfected with the indicated cargoes were incubated with biotin in presence or absence of 80 μM dynasore. Fluorescence within the TGN region was monitored as described in Figure 2A. Insets are shown in A’, C’, and E’. Arrows indicate post-TGN carriers. Average curves of TGN fluorescence are shown in B, D, and F (n = 9 and 9 cells from two independent transfections for SBP-emdGFP-VSV-G vehicle and dynasore, respectively; n = 19 and 20 cells from independent transfections for NPY-emdGFP-SBP vehicle and dynasore, respectively; n = 7 and 12 cells from three independent transfections for phogrin-emdGFP-SBP vehicle and dynasore, respectively). Data shown indicate mean ± SEM. Scale bar indicates 10 μm and 1 μm for insets.

