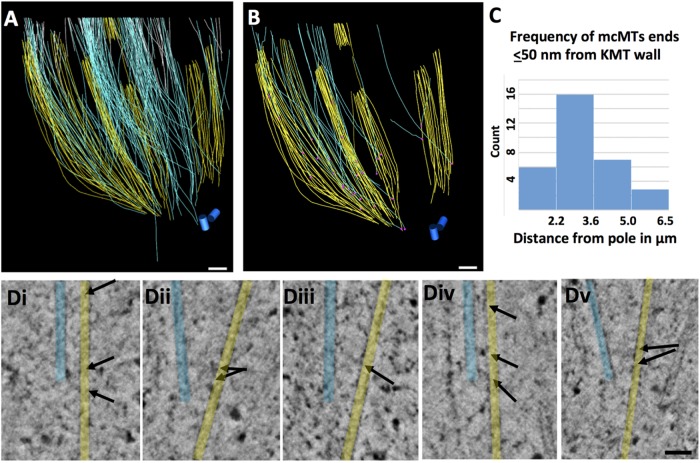
FIGURE 5:
mcMT interactions with KMTs in an RPE1 spindle. (A) A model built from five serial, 300-nm-thick sections, representing ∼1/5th of a metaphase spindle. KMTs (yellow; n = 86), mcMTs from either pole (white, n = 109, light blue, n = 134) and the centriole pair (blue cylinders). (B) Pink circles show the position of pole-proximal MT ends that lie ≤50 nm from a KMT (n = 32). Some mcMT ends make multiple close approaches. Bars in A and B = 500 nm. (C) Histogram showing the distribution of places where mcMTs end ≤50 nm from a kinetochore MT as a function of distance from the spindle pole. (D) Gallery of pole-proximal ends of mcMT (blue) within 50 nm of a KMT (yellow). Arrows mark structures we identify as bridges. Bar = 50 nm.

