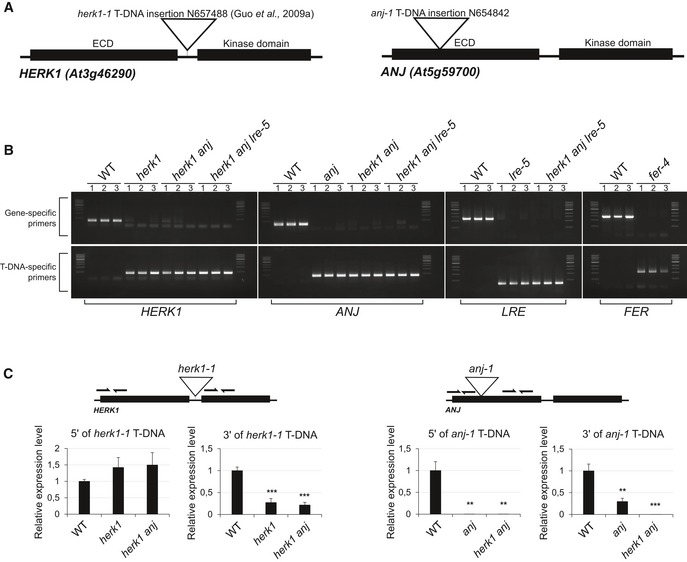
Figure EV1. Confirmation of ANJEA gene expression knock out and genotyping of T‐DNA lines used in this study.

- Domain organisation of HERK1 and ANJEA and T‐DNA insertion sites in the lines used in this study, herk1‐1 and anj‐1.
- Genotyping PCRs to verify homozygosity in the lines used in this study. DNA from three independent seedlings per line was analysed.
- RT–qPCR analysis of HERK1 gene expression in wild‐type, herk1 and herk1 anj plants, and ANJ gene expression in wild‐type, anj and herk1 anj plants. RNA was extracted from multiple inflorescences from three plants per line. Data presented are means ± SD. **P < 0.01; ***P < 0.001 (Student's t‐test).
Source data are available online for this figure.
