
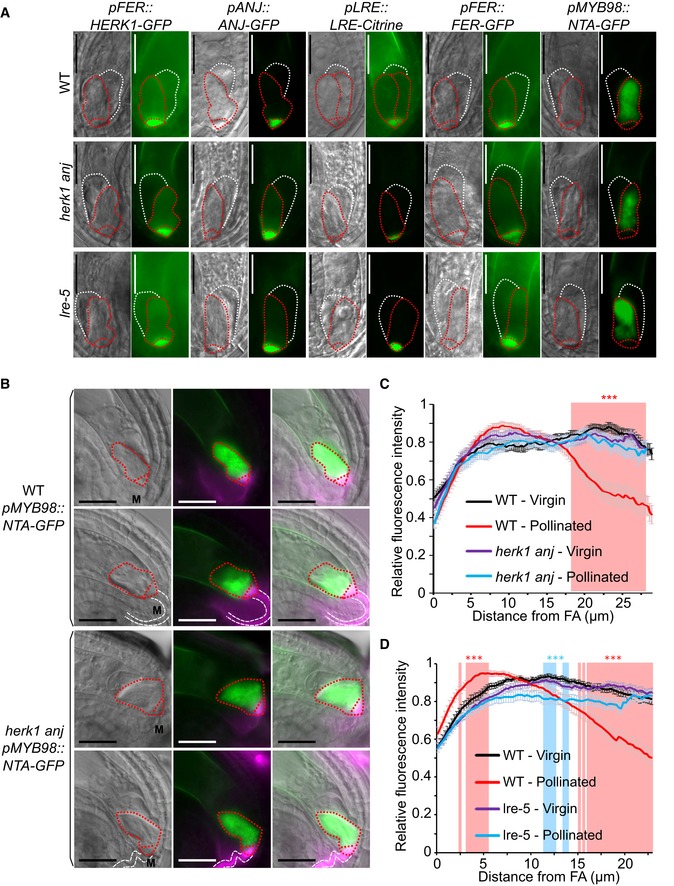
Figure 3. Normal synergid localisation of HERK1, ANJ, LRE, FER and NTA pre‐fertilisation and impaired relocalisation of NTA after pollen tube reception in herk1 anj and lre‐5 .
-
ALocalisation of HERK1, ANJ, LRE, FER and NTA in the synergid cell of wild type (Col‐0; WT), herk1 anj and lre‐5 in unfertilised ovules, as shown by pFER::HERK1‐GFP, pANJ::ANJ‐GFP, pLRE::LRE‐Citrine, pFER::FER‐GFP and pMYB98::NTA‐GFP. DIC and fluorescence images are shown, left to right, respectively. White and red dotted lines delineate the egg cell and synergid cells, respectively. Scale bars = 25 μm.
-
BLocalisation of NTA in the synergid cell of wild‐type and herk1 anj plants before (upper panels) and after (lower panels) pollen tube arrival. In green, NTA localisation as shown by pMYB98::NTA‐GFP fluorescence. In magenta, callose of the filiform apparatus and pollen tube stained with SR2200. From left to right, images shown are DIC, merged fluorescence images, and merged images of DIC and fluorescence. White and red dotted lines delineate the pollen tube and synergid cells, respectively. Scale bars = 25 μm. M, micropyle.
-
C, DProfile of relative fluorescence intensity of NTA‐GFP along the synergid cells of wild‐type and herk1 anj ovules (C); and wild‐type and lre‐5 ovules (D) before (virgin) and after (pollinated) pollen arrival. Data shown are means ± SEM, n = 25. ***P < 0.001 (Student's t‐test). FA, filiform apparatus.
Source data are available online for this figure.