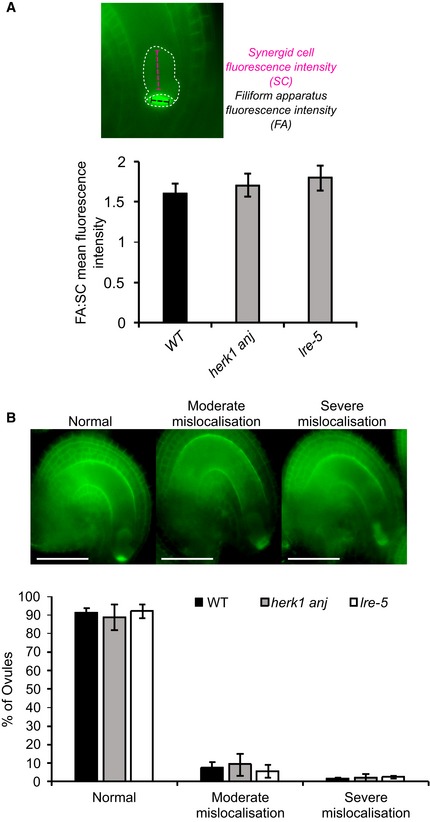
Figure EV3. Quantification of FER‐GFP mislocalisation in the synergid cells of herk1 anj and lre‐5 ovules.

-
ARatio between fluorescence intensities at the filiform apparatus (FA) and the synergid cell cytoplasmic region (SC) in mature ovules from wild‐type (Col‐0), herk1 anj and lre‐5 emasculated flowers expressing pFER::FER‐GFP. Fluorescence profiles for each region of the synergid cells were recorded as exemplified in the upper panel and averaged prior to the ratio calculation. At least 23 ovules obtained from three siliques per plant were scored for three plants per line, with means per plant (n = 3) used for the Student's t‐tests (P > 0.05). Data presented are means ± SD.
-
BQuantification of moderate and severe mislocalisation defects in the accumulation of FER‐GFP at the filiform apparatus in mature ovules from wild‐type (Col‐0), herk1 anj and lre‐5 emasculated flowers expressing pFER::FER‐GFP. Ovules with clear FER‐GFP expression were assigned to one of the three categories presented in the upper panel, as per Ref. 76. No statistically significant differences were detected in Student's t‐test comparisons with wild type. At least 23 ovules obtained from three siliques per plant were scored for three plants per line, with means per plant (n = 3) used for the Student's t‐tests (P > 0.05). Data presented are means ± SD.
Source data are available online for this figure.
