-
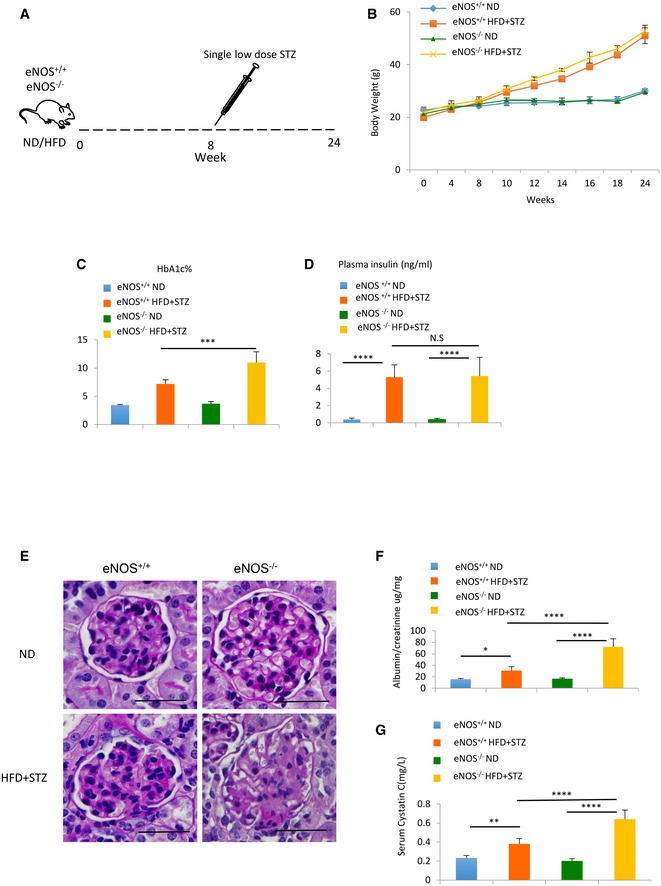
A
Schema illustrating mouse model of type 2 diabetic nephropathy (DN) using high fat diet (HFD) and a single‐dose streptozotocin (50 mg/kg) intraperitoneal injection.
-
B
Increment change of body weight in eNOS+/+ ND, eNOS+/+ HFD+STZ, eNOS−/− ND and eNOS−/− HFD+STZ.
-
C, D
HbA1c% (C) and plasma insulin level (D) change in eNOS+/+ ND, eNOS+/+ HFD+STZ, eNOS−/− ND and eNOS−/− HFD+STZ after 24 weeks of treatment.
-
E
Periodic acid–Schiff (PAS) staining of sections from eNOS+/+ ND, eNOS+/+ HFD+STZ, eNOS−/− ND and eNOS−/− HFD+STZ mouse kidneys. Scale bars: 50 µm.
-
F
Urinary albumin/creatinine ratio changes from eNOS+/+ ND, eNOS+/+ HFD+STZ, eNOS−/−ND and eNOS−/− HFD+STZ mouse.
-
G
Serum cystatin C changes from eNOS+/+ ND, eNOS+/+ HFD+STZ, eNOS−/− ND and eNOS−/− HFD+STZ mouse.
Data information: One‐way ANOVA was performed. Data are shown as mean ± SD from groups of eight mice. *
> 0.05.