-
A–H
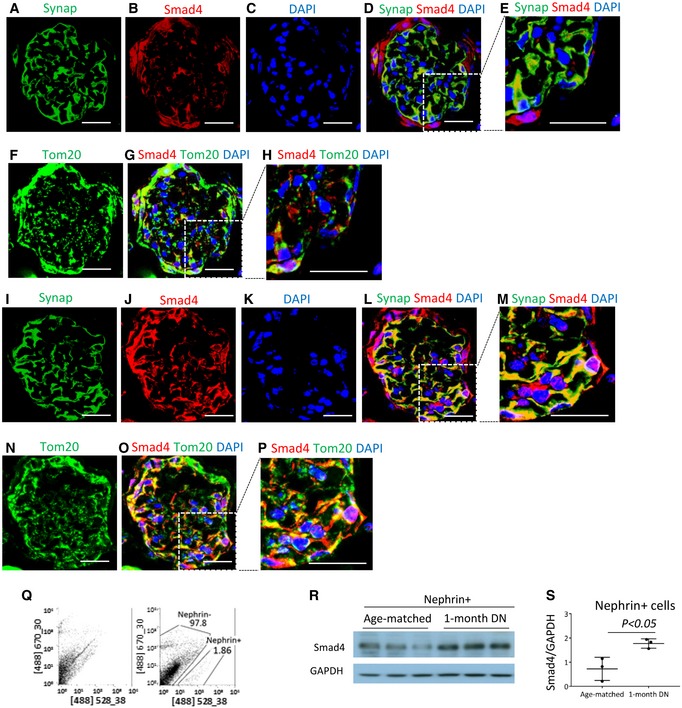
Confocal microscopy demonstrated synaptopodin (A, Synap, green), Smad4 (B, red), DAPI (C, blue), merged image (D, Synap+Smad4+DAPI), digital enlargement of part of D (E), Tom20 (F, green), merged image (G, Smad4+Tom20+DAPI) and digital enlargement of part of G (H) in normal mouse kidney. Scale bars: 30 µm.
-
I–P
Confocal microscopy demonstrated synaptopodin (I, Synap, green), Smad4 (J, red), DAPI (K, blue), merged image (L, Synap+Smad4+DAPI), digital enlargement of part of L (M), Tom20 (N, green), merged image (O, Smad4+Tom20+DAPI) and digital enlargement of part of O (P) in mouse DN (I–P). Scale bars: 30 µm. Of note, localization of Synap and Smad4, and Smad4 and Tom20.
-
Q
Nephrin (+) cells were isolated by FACS from mouse kidneys.
-
R, S
Western blotting demonstrated Smad4 expression in isolated nephrin (+) cells.
= 3. Data are shown as mean ± SD.

